
2011
TradingView Founded
TradingView was established by Konstantin Ivanov, Denis Globa, and Stan Bokov, launching a revolutionary web-based charting platform.
Last Updated: December 4, 2025
Hey everyone, and welcome to the ultimate TradingView guide for 2025 and beyond! If you’re here, you’re probably looking to get the most out of TradingView, and you’re in luck. In this guide, I’m going to walk you through everything from the basics (like setting up your account and getting comfortable with the interface) to the more advanced stuff (think drawing tools, technical indicators, paper trading, and even risk management). Whether you’re a beginner or have been trading for a while, this post is meant to be your comprehensive, no-fluff step-by-step guide for TradingView.
Prefer video? Watch this video to for a comprehensive, step-by-step TradingView tutorial designed to take your trading skills to the next level. In this guide, you'll learn how to set up your TradingView account, navigate its advanced charting tools, and apply proven technical analysis strategies. all in a clear, easy-to-follow format. Whether you're a beginner or an experienced trader, this video breaks down everything you need to know!
TradingView combines robust charting tools, technical indicators, and a social community in one platform, making it ideal for both beginner and advanced traders across stocks, forex, and crypto markets.
Essential indicators like MACD, RSI, Volume Profile, and ATR provide complementary insights when used together, helping identify momentum shifts, overbought/oversold conditions, and market volatility.
Multi-time frame analysis is a powerful technique that combines the "big picture" view from higher time frames with precise entry points from lower time frames, reducing false signals.
Paper trading allows you to practice strategies without financial risk, helping you build confidence, test trading plans, and understand order management before committing real capital.
Effective risk management (limiting risk to 1-2% per trade, maintaining favorable risk-reward ratios, and using proper stop-losses) is just as important as technical analysis for long-term trading success.
What is TradingView?
Alright, let’s start with the basics. If you’re not familiar with TradingView yet, buckle up—this platform is a real game changer for anyone trading stocks, forex, crypto, or even commodities. I remember when I first discovered TradingView, I was overwhelmed by its power and simplicity at the same time. It’s like having a professional trading desk right in your browser!
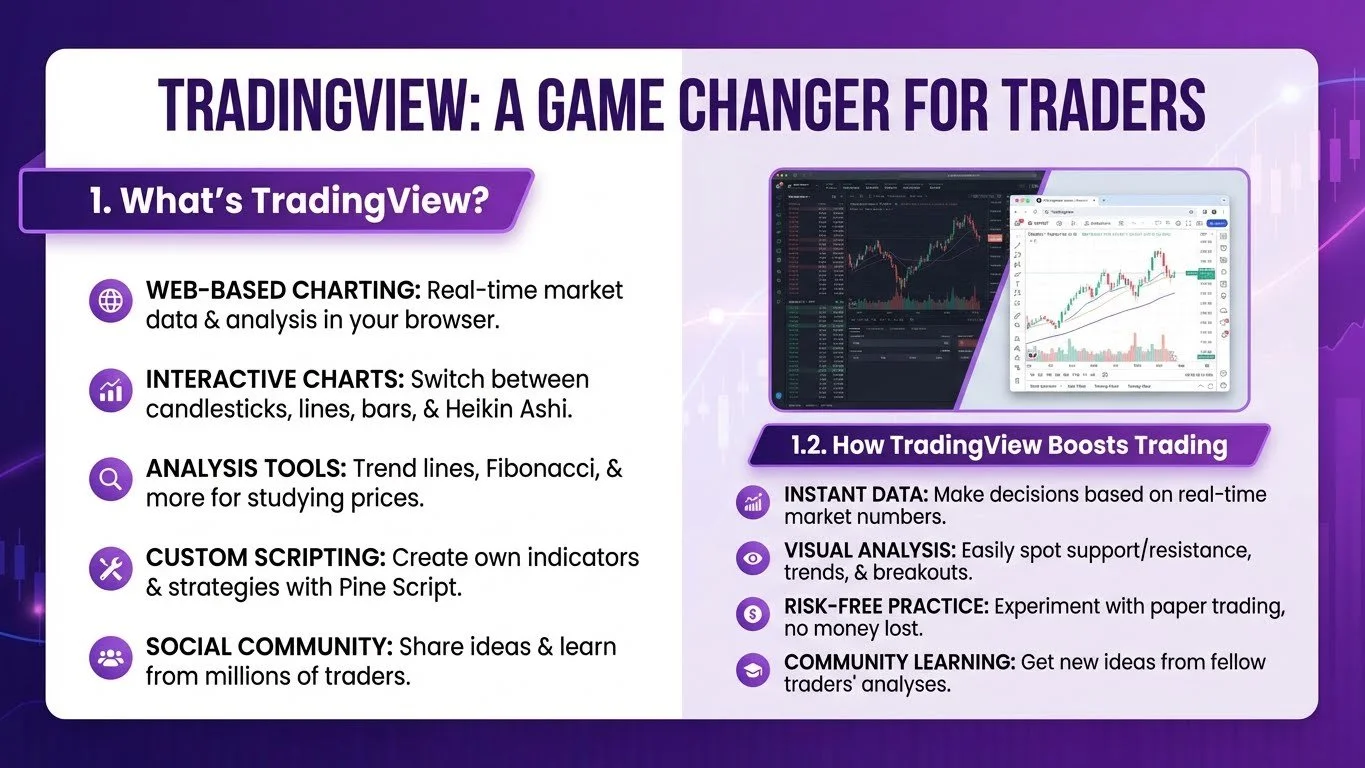
In everyday language, TradingView is a web-based charting tool that gives you access to real-time market data and a huge range of technical analysis features. Here’s what makes it stand out:
Interactive, Real-Time Charts: Whether you like candlesticks, lines, or bar charts (and even the cool Heikin Ashi style), TradingView lets you switch views in a snap.
A Bunch of Analysis Tools: From trend lines to Fibonacci retracements and beyond, you’ve got all the tools you need to study price movements.
Custom Scripting (Pine Script): If you’re into coding—or just like tinkering—TradingView lets you create your own custom indicators and strategies.
Social Community: One of the best features is the built-in community. You can see what other traders are thinking, share ideas, and even pick up some tips that might save you a lot of headache.
When I first sat down with TradingView, I was amazed by how accessible yet powerful it is. It’s not just a tool; it’s like joining a community of millions who are as passionate about trading as you are.
Let’s get real here: TradingView can change the way you trade. Here are a few reasons why:
Instant Data, Instant Decisions: With real-time data at your fingertips, you’re not waiting around for outdated numbers. That means you can make decisions based on what’s happening right now.
Clear, Visual Analysis: Instead of sifting through endless spreadsheets, you can visually see support and resistance levels, trends, and potential breakouts.
Practice Without the Risk: New to trading? No worries. TradingView’s paper trading feature lets you experiment with strategies without any real money on the line.
Learn from Others: The community aspect is invaluable. Sometimes, seeing how someone else analyzed a trade can spark an idea that you hadn’t considered before.
In short, if you want to be a smarter, more confident trader, TradingView is the platform to get on board with.
Before diving into advanced strategies and drawing tools, you first need to get set up. Let’s walk through the process of signing up and getting comfortable with the basics.
The sign-up process is pretty straightforward—trust me, I’ve done it countless times. Here’s how:
Visit TradingView.com: Open your web browser and type in TradingView.com. Once you land on the homepage, you’re halfway there.
Click “Sign Up”: You’ll see a big sign-up button. You can register using your Google account, Facebook, or just an email. Always try to find a TradingView Affiliate Link as you can get a $15 Bonus.
Choose Your Plan:
Free Plan: Perfect if you’re just getting started. It’s got loads of features, and honestly, it’s a great way to learn the ropes without spending a dime.
Essential or Premium Plans: When you’re ready for the heavy lifting—like more indicators per chart, ad-free viewing, and exclusive tools—consider upgrading. And hey, try out the free trial first if you’re not sure.
It really couldn’t be simpler. Once you’re signed up, take a few minutes to set up your profile and customize your settings. You can change your time zone, adjust notification settings, and even choose your default chart style.
| Features | Free | Essential | Plus | Premium |
|---|---|---|---|---|
| Charts per Layout | 1 | 2 | 4 | 8 |
| Indicators per Chart | 3 | 5 | 10 | Unlimited |
| Custom Indicators | - | 5 | 10 | Unlimited |
| Alerts | 1 | 5 | 10 | Unlimited |
| Watchlists | 1 | 5 | 10 | Unlimited |
| Chart Data Range | 1 Year | 5 Years | 10 Years | Full History |
| Bar Replay | - | ✓ | ✓ | ✓ |
| Volume Profile | - | - | - | ✓ |
| Second-Based Charts | - | - | - | ✓ |
| Multiple Monitors Support | - | - | ✓ | ✓ |
| Monthly Price | $0 | $14.95 | $29.95 | $59.95 |
| Basic | Get $15 Bonus & 30-Day Free Premium Trial | |||

Some TradingView features, like the volume footprint chart and advanced chart pattern tools, are exclusive to TradingView Premium.
After you sign up, you’ll find yourself staring at a dashboard full of menus, charts, and lots of potential. I know it can seem a bit overwhelming at first, but here’s a quick tour:
The Home Dashboard:
This is like your personal news feed for the markets. You’ll see market recaps, trending ideas, and posts from traders around the world.
The Navigation Bar:
Located at the top of the screen, it lets you switch between different asset classes (stocks, crypto, forex, etc.), access the screener, alerts, and even your personal watchlist.
The Chart Workspace:
This is where all the action happens. It’s the big, blank canvas where you’ll do your technical analysis.
Side Panels:
On the left and right, you’ll find extra tools like your watchlist, trading ideas, and chat rooms where you can talk with other traders.
Custom Layouts:
One of my favorite features is being able to save my chart layouts. Once you’ve got a setup you like, save it and load it up whenever you log in.
Take your time to click around and explore each section. The more familiar you get, the faster you’ll be able to analyze and make decisions when the market moves.
Now that you’re comfortable with the dashboard, let’s get into the heart of TradingView: the charts. This section is all about learning how to navigate, zoom, pan, and customize your charts to match your trading style.
TradingView offers several chart types, each with its own advantages. Here’s a quick rundown:
These are the classics. Each candlestick shows you the open, high, low, and close (OHLC) for a given period. I personally love candlestick charts because they give you so much detail at a glance. They help you see patterns, like engulfing candles or dojis, that can signal a reversal or a continuation in the trend.
Here are 16 candlestick patterns every trader should know from IG Markets

Reading Candlestick Charts: Each candle visually represents the open, high, low, and close (OHLC) over a specific time frame, offering comprehensive insights at a glance.
Line charts are super simple: they connect the closing prices with a smooth line. They’re great if you just want a quick look at the overall trend without getting distracted by the highs and lows. Perfect for long-term investors who care more about the overall direction than the intraday details.
Bar charts are pretty similar to candlesticks in the information they provide but are presented a little differently. They might not be as popular, but some traders swear by them for a cleaner look.
If you want to cut through all the noise, Heikin Ashi charts might be for you. They smooth out the price data, which makes trends easier to spot. The trade-off? You lose some of the detailed information about each individual period. Use them when you’re trying to focus on the big picture rather than the day-to-day fluctuations.
I remember experimenting with all these chart types when I started out—it took a bit of trial and error to find what felt right. Don’t be afraid to switch between them until you find your preferred style.
Let’s get into the nitty-gritty of moving around on your charts. These might seem basic, but knowing how to do them quickly can really speed up your analysis.
Zooming:
Horizontal Zoom: Simply scroll your mouse wheel to zoom in or out along the time axis. It’s that intuitive.
Vertical Zoom: Click and drag along the price scale on the right side of the chart. This helps you get a closer look at price levels.
Panning:
Click and hold anywhere on the chart (except on an indicator), then drag to move the chart around. This is super useful when you want to check out historical price data or see what’s happening on the far left of the screen.
Auto-Scale and Logarithmic Mode:
TradingView has an auto-scale feature that adjusts the view to fit the data. If you’re dealing with assets that have massive price changes over time, switch to logarithmic mode. This mode helps you see percentage moves more clearly, which is crucial when you’re analyzing long-term trends.
Customization is where TradingView really shines. When you set up your charts the way you like, it can make a huge difference in your comfort and efficiency.
Choosing a Theme:
You can go for a dark theme or a light theme, depending on your preference. Personally, I’m a big fan of dark mode—it's easier on the eyes during those late-night sessions.
Adjusting Colors and Gridlines:
Right-click anywhere on your chart and select “Settings.” Here, you can change the colors of your candlesticks, the gridlines, even the background color. Play around with these settings until your chart feels like home.
Saving Your Layout:
Once you’ve dialed in your perfect look, save it as a template. That way, you won’t have to set everything up from scratch every time you log in.
I’ve spent hours tweaking my chart settings over the years, and trust me—it pays off in the long run. A chart that looks good is a chart that works well for you.
Use this interactive checklist to optimize your TradingView workspace and ensure you're getting the most out of the platform.
Alright, let’s get into the fun part. Now that you know your way around the charts, it’s time to learn how to mark them up with drawing tools and technical analysis features. These are the things that’ll help you “read” the market like a pro.
If you’re new to technical analysis, this beginner’s guide from BabyPips is a solid beginner friendly resource.
When you start drawing on your charts, it might feel a little like doodling at first. But don’t worry—these tools are there to help you visualize trends and key levels.
Trend lines are one of the most basic, yet effective, tools in a trader’s arsenal:
Pick Your Tool: Click on the “Trend Line” icon in your toolbar.
Plot the Points: For an uptrend, click on a significant low and then click on the next higher low. For a downtrend, do the opposite.
Fine-Tune It: Drag the line until you’re happy with the number of touches it makes along the trend. I remember my first few attempts—I’d misplace the line until I learned what the key lows and highs were.
Trend channels are simply two parallel trend lines that mark the upper and lower boundaries of a trend:
Start with a Trend Line: Draw your main trend line as described above.
Duplicate and Adjust: Copy the line (most platforms let you do this with a quick CTRL+C and CTRL+V) and adjust it so it runs parallel. This gives you a visual “channel” where the price tends to bounce between.
Use for Entries/Exits: When the price touches the upper channel, that might be your resistance; the lower channel might be support. These are good markers for potential entry or exit points.
Patterns like head and shoulders, double bottoms, or ascending triangles can provide hints about where the market is heading next:
Outline the Pattern: Use trend lines or even the rectangle tool to highlight the pattern. Don’t stress if it’s not perfectly symmetrical—often, it’s more of a general area than an exact line.
Breakouts: The moment when the price breaks out of a pattern is a key signal. That’s your cue to either enter or exit a trade.
I used to get hung up on drawing “perfect” lines, but the truth is—markets are messy. Focus on capturing the overall trend and key zones rather than obsessing over precision.
Support and resistance levels are like the guardrails on a roller coaster—they help you know where the price might bounce or break:

What is Support and Resistance? Support and resistance are key concepts in technical analysis that help traders understand where prices might stop falling or rising. In simple terms, support is the price level where a stock or asset tends to stop falling because buyers step in, while resistance is the level where the price often stops rising due to selling pressure.
Horizontal Lines:
The simplest method is to use the horizontal line tool to mark levels where the price has bounced off multiple times.
Drawing Zones:
Sometimes the price doesn’t reverse at a single point but rather in an area. Use the rectangle tool to shade these zones. I often call these “support zones” or “resistance zones” because they cover a range rather than a specific number.
Volume Confirmation:
Always cross-check these levels with volume. High volume at a certain price often means that level is significant.
I like to think of support as a “floor” and resistance as a “ceiling.” When the price breaks through these levels, it can be a signal that something big is about to happen.
For a deeper dive into support and resistance, check out this Investopedia guide.
Now, let’s talk about one of the most talked-about tools in trading—Fibonacci retracements and extensions. I know they can sound a bit mysterious at first, but stick with me.
How It Works:
The idea behind Fibonacci retracements is that markets often pull back a predictable percentage of a move before continuing in the same direction.
Drawing Them:
Select the Fibonacci retracement tool, click at the beginning of a major price move, and drag it to the end of that move. You’ll see levels at 23.6%, 38.2%, 50%, 61.8%, and 78.6%.
Application:
These levels often act as support or resistance. For example, in a strong uptrend, if the price pulls back to the 61.8% level, that might be a good time to jump back in.
When to Use Them:
Fibonacci Extensions come into play when you’re trying to forecast how far the price might go after breaking out of a retracement. They’re useful for setting profit targets.
Combining Them:
I like to use retracements to identify potential entry points and extensions to map out where my target levels might be.
I remember the first time I saw Fibonacci levels on a chart—it felt like a secret code. Now, after years of using them, I find they’re just one tool among many. Use them to complement your overall analysis.
Indicators are like the spices in your trading kitchen—they can really enhance your analysis if used correctly. TradingView comes with a ton of built-in ones, plus a huge community that creates custom scripts. Here’s a look at the ones I rely on most.
Let’s start with some basics that every trader should know about:
What It Does:
MACD compares two moving averages (usually the 12- and 26-period EMAs) to gauge momentum. It helps you spot when momentum is shifting.
How to Read It:
Look for the MACD line crossing above the Signal line as a bullish sign, and the opposite for bearish signals. Also, keep an eye out for divergences where the MACD isn’t following the price.
Learn more about MACD and how it works in this Investopedia article.

What is MACD? MACD (Moving Average Convergence Divergence) is a technical analysis indicator that shows momentum changes in a stock’s price. It compares two moving averages and signals potential trend shifts and reversals.
The Essentials:
The RSI is a momentum oscillator that ranges from 0 to 100. Values above 70 mean the asset might be overbought, while below 30 suggests oversold conditions.
Why It’s Useful:
It’s a great tool to help time your entries and exits, especially when you see divergences (where price makes a new high, but RSI doesn’t).
Volume Speaks Volumes:
Volume in trading is the ultimate confirmation tool. A breakout with high volume is typically more reliable than one with low volume.
Volume Profile:
This indicator shows you how much trading is happening at various price levels. It’s especially useful for spotting major support and resistance areas.
What ATR Measures:
ATR gives you an idea of the asset’s volatility. It tells you how much the price tends to move in a given period.
Using ATR:
I use ATR to set my stop-loss levels—if the market is more volatile, the stops will be wider to avoid getting whipsawed out.
Use this comparison to understand when and how to apply each essential indicator. The best results come from combining 2-3 indicators for confirmation.
Confirm trend direction with momentum, validate with volume
Spot exhaustion with RSI, confirm with MACD divergence
Use ATR to set appropriate stop-loss regardless of strategy
💡 TradingView Premium lets you add unlimited indicators per chart for complete analysis
Get $15 Bonus + 30-Day Free TrialLet’s break down the MACD a little more:
Components:
You’ll see two lines—the MACD line and the Signal line—and a histogram that represents the difference between the two.
Interpretation:
When the MACD line crosses above the Signal line, it’s a signal to consider buying. When it crosses below, it’s time to think about selling or staying out. And don’t forget divergence—if the MACD is trending in one direction while the price does something different, that’s a red flag.
The RSI is straightforward, but there’s nuance:
Reading the Levels:
Generally, an RSI above 70 means the asset might be due for a correction, while below 30 might indicate a rebound.
Combining Signals:
I often look for situations where the RSI diverges from the price action. If the price is making new highs but the RSI isn’t, it might be a good time to get cautious.
Pairing with Other Indicators:
Using the RSI along with MACD gives a fuller picture of momentum.
Volume:
Always check the volume bars below your chart. High volume on an up move is a strong sign, and low volume on a breakout might be a warning.
ATR:
I rely on ATR to decide how much room to give my trades. A choppy market means a higher ATR, so I widen my stops accordingly.
Once you’ve mastered the basics, it’s time to explore some of the more advanced features that can really give your trading an edge.
Multi-time frame analysis is one of those techniques that can transform your trading:
How It Works:
The idea is to look at the same asset on different time frames. For example, you might check the daily chart to understand the overall trend and then switch to a 15-minute chart to find a precise entry.
Setting Up:
TradingView lets you set up split-screen layouts. I usually have two or three charts open so I can see the “big picture” and the details at the same time.
Benefits:
This technique helps confirm trends and prevents you from getting caught in false breakouts. It’s like having a bird’s-eye view and a magnifying glass at the same time.
Screeners are super handy for finding trading opportunities without having to manually sift through hundreds of assets:
Stock Screener:
Filter stocks based on market cap, P/E ratio, or technical signals. I like to use the screener to spot stocks that meet my criteria before I dive into a chart.
Crypto Screener:
For the crypto crowd, this tool helps you find coins with high volume or significant price moves.
Custom Filters:
The beauty of TradingView is that you can set up your own filters. For example, you can filter for stocks with an RSI below 30 or a MACD crossover in the last few days.
Paper trading is a lifesaver, especially when you’re trying out new strategies:
Paper Trading Tutorial: Learn how to use risk-free simulated trading on TradingView with this step-by-step paper trading guide. Learn how to set up a TradingView paper trading account and execute trades without risking real money!
What Is It?
It’s a simulated trading environment where you use virtual money. This way, you can experiment without the risk of losing real cash.
How to Set It Up:
In the Trading Panel, simply choose “Paper Trading.” You’ll start with a set balance—commonly $100,000, though you can change that if you want.
Why You Should Do It:
Before you commit real money, it’s wise to practice your strategies in a risk-free environment. This not only helps build confidence but also teaches you how to manage orders, set stop-losses, and monitor your trades in real time.
I’ve personally saved myself many mistakes by paper trading first. It’s a great way to test the waters and learn how to control your emotions when trades don’t go as planned.
Setting up alerts in TradingView allows you to get notified of important market moves without constantly watching your charts. Follow this step-by-step guide to create powerful, customized alerts that will transform your trading efficiency.
Click on the bell icon 🔔 in the top right corner of your chart, or right-click on any price level and select "Add Alert".
Choose the condition that will trigger your alert:
Set up the parameters for your alert:
Click "Create" to set your alert. It will now appear in your Alerts tab for management.
Want unlimited alerts with advanced conditions, server-side monitoring, and more alert delivery options?
Get TradingView Premium (30-Day Free Trial + $15 Bonus)One of the coolest features on TradingView is the alert system. Alerts let you step away from your screen without missing a beat.
Setting up an alert is as easy as it gets:
Find the Alert Icon:
Look at the top-right corner of your chart and click on the alert icon.
Set Your Conditions:
Choose a condition—like “Price Greater Than” or “Price Less Than”—and enter the target level.
Customize Your Notification:
Decide if you want to be alerted once or every time the condition is met. You can also choose the type of notification: pop-up, sound, email, or even mobile.
Save It:
Your alert will now be active on your chart. You can edit or remove it anytime.
This is a huge help when you’re away from your desk but don’t want to miss an important market move.
For those who like to get a bit fancier:
Indicator-Based Alerts:
Instead of just price, set alerts based on indicators like the RSI or MACD. For example, you can have an alert when the RSI goes above 70 (meaning the asset might be overbought) or drops below 30.
Multiple Conditions:
Some strategies call for layered alerts. You might set one alert for a price level and another for an indicator. This way, you’re covering all your bases.
Organizing Alerts:
If you’re running several alerts, keep them organized so you’re not overwhelmed by notifications. I often label them clearly with the condition and asset name.
Using alerts properly means you’re always in the loop, even when you’re busy with other things.
Now, here’s something fun, my personal ranking of TradingView indicators. Keep in mind, this is totally subjective and based on my own trading style. You might have a different ranking, and that’s cool!
Watch my fun, subjective ranking of TradingView indicators here. Discover which technical tools I trust to boost my trading, and compare my picks with your own for fresh insights into refining your strategy.
These are the indicators that, in my opinion, are absolutely essential:
Pivot Points & Price Action:
Understanding where the market has reversed before is key. I always say that nothing beats good old-fashioned price action when it comes to identifying trends.
MACD & RSI:
These two go hand in hand for me. They’re my go-to tools for spotting momentum shifts and divergences.
Market Structure:
Not an “indicator” in the traditional sense, but learning to read market structure is invaluable. Once you understand support, resistance, and the overall trend, the rest falls into place.
These ones are really useful, though they might not be the magic bullet:
ATR (Average True Range):
I rely on ATR to measure volatility and to set my stop-losses. It’s a real lifesaver on volatile days.
Volume and Volume Profile:
They give you a sense of how strong a move is. When price moves with high volume, you know it’s not just a fluke.
These are good, but I wouldn’t base my entire strategy on them:
Fibonacci Retracements/Extensions:
Very helpful for beginners and for setting targets, but they can be a bit subjective.
Other Moving Averages and Custom Scripts:
There are loads of custom indicators out there. Use them as supplements, but don’t overdo it. Sometimes, less is more.
At the end of the day, it comes down to your trading style:
Day Traders:
Might prefer shorter-term indicators (like a 5-minute RSI or MACD) to capture quick moves.
Swing Traders:
Look at a mix of time frames and indicators that capture the broader trend.
Long-Term Investors:
Focus on overall market trends, support and resistance, and longer-term moving averages.
I encourage you to experiment and figure out what combo works best for you. There’s no one-size-fits-all in trading.
Now, let’s get serious for a minute. No matter how awesome your technical analysis is, if you’re not managing your risk or your emotions, you’re in trouble. Here’s how I keep my cool and my capital safe.
I can’t stress this enough—protecting your money should be your number one priority:
Preserving Capital:
I always tell new traders, “Don’t risk more than you can afford to lose.” That’s why I stick to risking only 1-2% of my account on any single trade.
Cutting Losses:
Even the best strategies have losing trades. Use stop-loss orders to make sure one bad trade doesn’t wipe you out.
Consistent Growth:
It’s better to have many small wins than a few big wins followed by a catastrophic loss.
Here are some of the methods that have saved me more times than I can count:
Fixed Percentage Risking:
I only risk a small percentage of my account per trade. This way, even if I have a few losses in a row, my account isn’t devastated.
Stop-Loss Orders:
Always set a stop-loss. I like to place mine based on technical levels, like just below a support zone or using ATR to give a bit of breathing room.
Risk-Reward Ratio:
I aim for at least a 1:2 or 1:3 ratio. If I risk $100, I’m aiming to make $200 or $300. This ensures that even with a few losses, the wins will cover them.
Diversification:
Don’t put all your eggs in one basket. Spread your trades across different assets and strategies.
Trading isn’t just about numbers; it’s about mindset too. Here’s how I handle the emotional side:
Stay Disciplined:
Emotions like fear and greed can lead to impulsive decisions. I stick to my trading plan no matter what.
Learn from Losses:
Every trader has bad days. I keep a trading journal so I can look back, learn from my mistakes, and adjust my strategy.
Be Patient:
Sometimes the market tests you. Patience can be the difference between a knee-jerk reaction and a well-timed trade.
Mindfulness and Balance:
I take breaks when needed. Sometimes stepping away for a moment helps me see the bigger picture more clearly.
Remember, a successful trader isn’t just a technical wizard—they’re also someone who can control their emotions and stick to their plan.
We’ve covered a lot of ground today—from the basics of TradingView to the nitty-gritty of technical analysis and risk management. Let’s do a quick recap and talk about what has been and what’s next:
TradingView was established by Konstantin Ivanov, Denis Globa, and Stan Bokov, launching a revolutionary web-based charting platform.
In the summer of 2013, TradingView released its beta version and joined the TechStars accelerator, securing key contracts with Microsoft and CME.
In 2015, TradingView secured $3.6M in seed funding from iTech Capital and other investors, setting the stage for rapid growth.
May 2018 marked a major milestone with a $37M Series B round led by Insight Venture Partners, Jump Capital, and DRW Venture Capital.
TradingView acquired TradeIt in 2019 to integrate brokerage connectivity and further enhance trading functionality.
October 2021 saw TradingView complete its Series C round, reaching a valuation of $3B and expanding premium features like the volume footprint indicator.
In January 2024, Oleg Mukhanov was appointed CEO to guide TradingView into its next phase of innovation and global expansion.
Today, TradingView is the leading platform for traders and investors worldwide, with advanced charting tools, a vibrant community, and seamless broker integrations.
Try TradingView Premium with our exclusive offer:
Get $15 Bonus & 30-Day Free Premium AccessTradingView is a Powerful Platform:
It gives you real-time data, a wealth of technical tools, and a supportive community—all in one place.
Customize Your Setup:
Make your charts your own. Customize layouts, choose your favorite themes, and save your preferred settings.
Use a Mix of Tools:
No single indicator will give you all the answers. Combine trend lines, MACD, RSI, and volume analysis to build a solid picture of what’s happening.
Manage Your Risk:
Protect your capital with smart risk management techniques and never let your emotions run the show.
Keep Learning:
The markets evolve, and so should your strategies. Use paper trading, read up on new techniques, and stay curious.
Dive Deeper:
Check out additional tutorials and courses on trading. There’s always more to learn!
Practice Makes Perfect:
If you haven’t already, try out paper trading. It’s the safest way to refine your strategies.
Join the TradingView Community:
Engage in forums, share your ideas, and learn from other traders. Trading is a team sport—even when you’re in it alone.
Experiment and Adapt:
Use everything you’ve learned here to fine-tune your trading setup. Over time, you’ll develop a system that fits your personality and goals.
If you found this guide helpful, here’s what I’d love for you to do:
Drop a Comment:
Let me know about your TradingView setup, your favorite tools, or any questions you might have.
Subscribe:
For more real-talk trading tutorials and in-depth strategies, hit that subscribe button.
Share with Fellow Traders:
If you know someone who could use a better understanding of TradingView, pass this guide along.
Use Our Referral Link:
When you sign up for TradingView (or upgrade your plan), consider using our referral link. Not only do you get some bonus perks, but it also helps support the channel and our future content.
TradingView is an advanced, web-based charting platform that provides real-time data and comprehensive technical analysis tools. It stands out because it combines interactive charts, a vast library of indicators, custom scripting (Pine Script), and a thriving social community all in one platform. It's ideal for traders of all experience levels looking to analyze markets, develop strategies, and share ideas with millions of other traders worldwide.
The best chart type depends on your trading style and what information you value most. Candlestick charts are most popular because they show detailed open, high, low, and close (OHLC) data, making them ideal for pattern recognition. Line charts provide a cleaner view of overall trends by only connecting closing prices, making them useful for long-term investors. Heikin Ashi charts smooth out price action to better visualize the trend direction while filtering out some noise. Experiment with different types to find what works best for your specific analysis needs.
Yes, TradingView offers direct trading integration with numerous brokers through its Trading Panel feature. This allows you to execute trades without leaving the platform. The available brokers vary by region, so check which ones are compatible with your location. This integration streamlines your workflow by letting you analyze markets and place trades all in one interface, eliminating the need to switch between multiple platforms.
To set up effective alerts, click the bell icon in the top-right corner of your chart. You can create alerts based on price levels (when price crosses above/below a certain value) or indicator conditions (such as when RSI crosses above 70). For maximum effectiveness, be specific with your conditions, choose appropriate notification methods (pop-up, email, mobile push, etc.), and decide whether the alert should trigger once or every time the condition is met. Well-configured alerts help you stay on top of market opportunities without constantly watching your charts.
Effective risk management is crucial for long-term trading success. Some essential strategies include: limiting your risk to 1-2% of your capital per trade; using stop-loss orders based on technical levels or ATR to protect against excessive losses; maintaining a favorable risk-reward ratio (at least 1:2 or 1:3) to ensure your winning trades outweigh your losses; diversifying across different assets and strategies to avoid overexposure; and keeping a trading journal to track and learn from your decisions. Remember that protecting your capital should always be your first priority.
For serious traders, TradingView Premium offers significant value through features like multiple charts per layout, more indicators per chart, volume profile, advanced alerts, server-side alerts, and extended data history. The Premium or Premium+ plans remove limitations that can hamper detailed analysis. While the free plan provides good basic functionality, traders who rely on technical analysis for decision-making will likely find the investment in Premium worthwhile for the enhanced toolkit and expanded capabilities it provides.
TradingView isn’t just another tool—it’s a whole ecosystem that, when used correctly, can seriously transform your trading. From customizing your charts to using advanced indicators and managing your risk, this guide has covered nearly everything you need to know to get started and improve your trading game.
Remember, trading is a journey. You’ll learn more from your mistakes than from your successes, so don’t be afraid to experiment, test new strategies, and, most importantly, keep learning. Every trader’s journey is different, and the key is to find what works for you and stick with it.
Thanks for spending time with me on this deep dive into TradingView. I hope you find the tips and techniques in this guide practical and that they help you trade with more confidence in 2025 and beyond. If you have any questions, suggestions, or just want to share your experiences, drop a comment below—I’m always eager to hear from you.
Happy charting, and here’s to making smarter, more informed trades!
Compare TradingView's Premium, Plus, Essential and Free plans to find out which subscription offers the best value for your specific trading needs.
Discover legitimate ways to access TradingView's premium features without paying full price, including exclusive bonus offers and trial extensions.
Master Fibonacci retracement settings in TradingView and learn how to identify the powerful "Golden Zone" for high-probability trading opportunities.
Learn how to set up and use the Auto Chart Patterns indicator in TradingView to automatically detect profitable chart patterns across any market.
Trading & Investing Enthusiast
Teaching traders to understand market psychology, technical analysis, and investing through clear beginner-friendly insights.
Started investing at 16 and became fascinated by how market psychology influences price movements. Still learning something new every day.
Love sharing what I've learned along the way. There's nothing quite like helping someone understand a concept that once confused me too.
Proud to have built a community where traders actively share insights and grow together through daily market analysis and discussion.
Want to join our learning journey?
Unlock every feature covered in this tutorial