
The Breakout TradingView Indicator: Your Ultimate Guide to Price Action Trading
Learn to use TradingView's powerful breakout indicators to spot high-probability trading opportunities in any market.
Are you a visual learner? Watch the full breakout trading strategy in this YouTube video. You'll learn how to identify high-probability breakout setups, analyze volume patterns that confirm real breakouts, spot the telltale signs of dangerous fakeouts before they trap you, and implement the complete 4-step breakout trading system with real chart examples.
Volume is the #1 indicator that separates real breakouts from fakeouts—genuine breakouts almost always show a significant increase in volume at the breakout point.
Look for "momentum candles" that are at least twice (preferably three times) the size of previous candles—these indicate strong conviction behind the breakout move.
Identify specific chart patterns (triangles, ranges, flags) that typically precede breakouts to anticipate high-probability trading opportunities.
Controlling FOMO is essential for breakout trading success—create a trading plan before breakouts occur rather than chasing price action emotionally.
Always use proper risk management with a minimum 2:1 reward-to-risk ratio and stop-losses placed at levels where your breakout thesis is clearly invalidated.
Have you ever lost money on what looked like a perfect breakout, only to watch it reverse against you? If so, you're not alone. Breakout trading can be highly profitable, but it's also riddled with traps for the unwary trader.
In this comprehensive guide, I'll show you breakout trading strategies that not only help you identify real breakouts but, more importantly, help you avoid the false ones that damage your trading account. These are battle-tested methods that work across all markets—whether you trade stocks, forex, or cryptocurrencies.
Before diving into the strategies, let's clarify exactly what we're looking for. Understanding the critical differences between breakouts and fakeouts is essential for trading success.
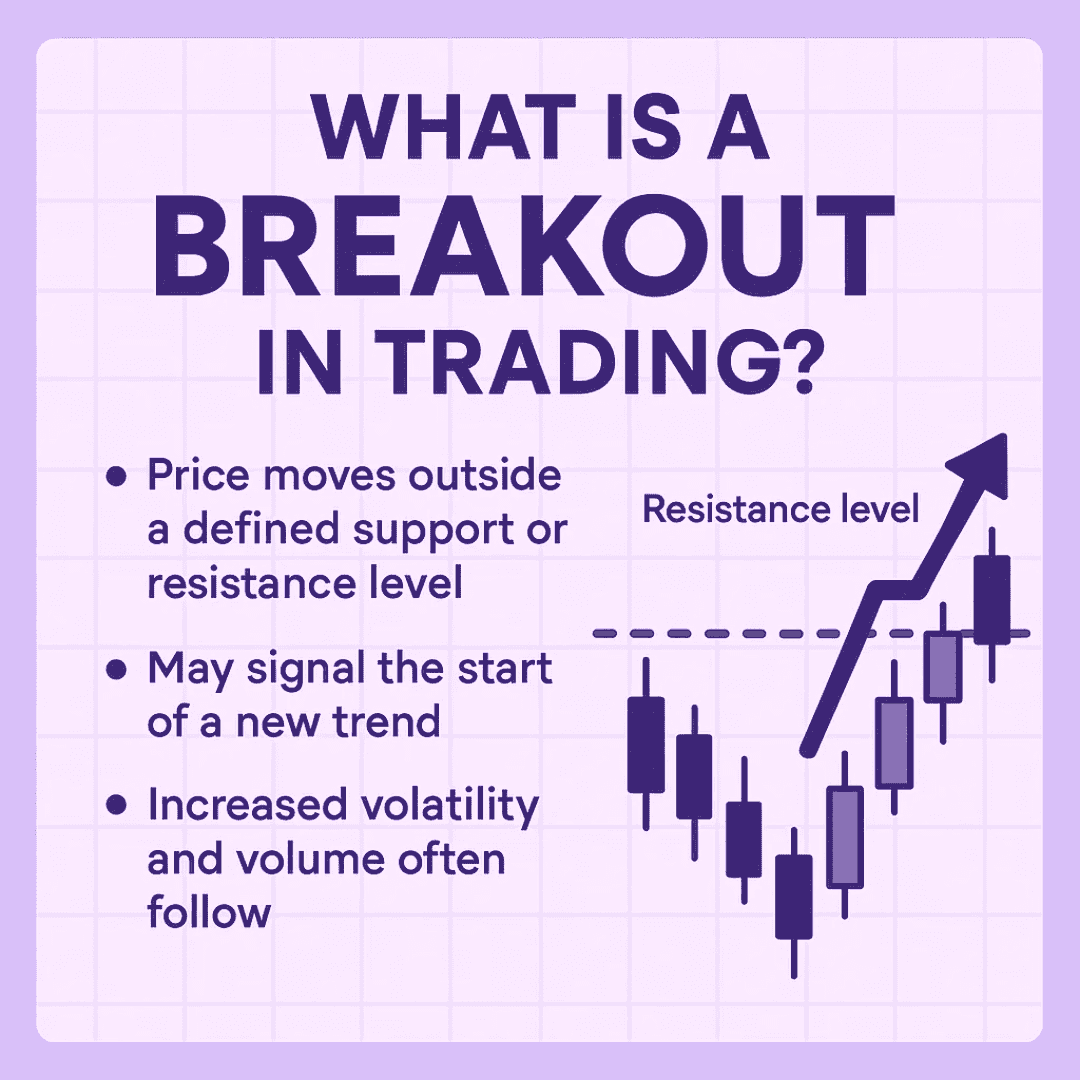
What is a Breakout in Trading? A breakout is when the price moves outside a defined support or resistance level with lots of momentum. Increased volatility and volume often follows the move.
A breakout occurs when price moves outside a defined support or resistance level with increased momentum. This momentum factor is critical—it's what separates genuine breakouts from false ones.
Breakouts serve two primary purposes:
They signal strong new trends, allowing you to get in early
They provide opportunities for quick in-and-out trades with significant profit potential
This versatility is why breakout trading remains popular among traders of all experience levels. When properly executed, breakout strategies can capture the beginning of powerful trend moves before most market participants recognize them.
A fakeout looks like a breakout initially but quickly reverses back into the previous range, failing to sustain the initial move. These are among the most common traps for beginner traders, frequently driven by FOMO (Fear Of Missing Out).
Fakeouts tend to be more common in:
Low volume environments
Situations with no strong fundamental catalyst behind the move
Periods of market manipulation designed to trigger stop-losses
In fact, many professional traders deliberately create fakeouts as part of their strategy—a technique known as "liquidity grabs." These moves are designed to sweep up stop-losses before the price reverses in the intended direction.
Now that we understand what we're looking for, let's break down my systematic approach to identifying and trading breakouts with a high probability of success.
Look for consolidation patterns that precede breakouts:
The #1 indicator separating real breakouts from fakeouts:
Consider waiting for price to retest the broken level:
Look for "momentum candles" with these characteristics:
Ready to implement this strategy? Get premium tools for chart pattern recognition, volume analysis, and custom breakout alerts with TradingView Premium:
Try TradingView Premium Free for 30 Days + $15 BonusThe first step is to look for specific chart patterns that frequently precede breakouts. These include:
Triangles (symmetrical, ascending, descending)
Ranges (horizontal support and resistance)
Flags and pennants
Double tops/bottoms with clear resistance/support
These patterns represent periods of consolidation before a potential expansion in price. They provide structure and help you anticipate the exact breakout points with precision.
Chart patterns aren't random formations—they represent the psychological battle between buyers and sellers, reaching a point where one side will eventually overpower the other. When you can identify these patterns early, you position yourself to capitalize on the coming breakout before the crowd.
Volume is absolutely critical—it's the key separator between genuine breakouts and false moves. A real breakout is almost always accompanied by a surge in volume.
What to look for:
Relative volume increase: The breakout candle should show significantly higher volume than the previous several candles
Volume confirmation: Volume should surge as price breaks through the level
Low volume warning: If a price breaks a level on low volume, be very cautious—this is often a precursor to a fakeout
Think of volume as the "fuel" for the breakout. Without sufficient fuel, the breakout vehicle won't travel far before stalling and reversing. Many traders focus exclusively on price action and ignore this crucial volume component, which is why they frequently get trapped in false breakouts.
Some traders prefer to wait for a retest of the broken level before entering a position. For example, if price breaks above resistance, they'll wait for it to return and test the old resistance (which should now act as support) before buying.
The advantages of waiting for a retest include:
Higher probability setups: Many fakeouts never retest successfully
Better risk-to-reward ratio: Tighter stop-loss placement is possible
Confirmation of level flip: You verify that old resistance is now acting as support (or vice versa)
However, this approach is optional. Some aggressive traders prefer to enter immediately on the breakout to avoid missing strong moves that never pull back. There's no universally "correct" approach—both can work if traded consistently and with proper risk management.
The characteristics of the actual breakout candle provide crucial information about the strength and likelihood of the breakout succeeding.
Key factors to examine:
Candle size: A strong breakout candle should be at least twice, preferably three times, the size of previous candles
Candle close: The candle should close decisively beyond the breakout level (not just wick through it)
Lack of wicks: Long wicks in the breakout direction may indicate rejection
Momentum: The strength of the move matters—weak, gradual breaks are more likely to fail
I call strong breakout candles "momentum candles," and they're one of the most reliable indicators of a genuine breakout. When combined with the volume surge we discussed earlier, they provide a powerful confirmation signal.
Let's examine real market examples to see these principles in action.
Looking at Bitcoin on the 4-hour timeframe, we can identify a textbook breakout:
A symmetrical triangle formed with consecutive lower highs and higher lows
A powerful breakout candle emerged that was approximately three to four times larger than previous candles
Volume increased significantly during the breakout compared to previous periods
The price continued strongly in the breakout direction without significant pullback
This setup demonstrates all the key elements of a high-probability breakout:
A clear chart pattern (symmetrical triangle)
A strong momentum candle breaking out
Significantly increased volume confirming the move
Decisive price action following the breakout
Trading this setup with entry at the breakout candle close and a stop-loss below the pattern would have resulted in an excellent risk-to-reward ratio, with profits quickly accumulating as the new trend established.
In another Bitcoin example, we saw what appeared to be an ascending triangle pattern with a breakout above resistance. However, several warning signs were present:
The breakout candle volume was similar to previous candles, not showing the surge we want to see
The breakout candle, while larger than its immediate predecessor, wasn't significantly larger than other recent candles
The overall momentum of the breakout wasn't as decisive
This setup falls into a "gray area"—not terrible, but certainly containing warning signs that might make an experienced trader hesitate or use tighter risk management. These marginal setups often lead to smaller moves or potential fakeouts.
The psychological aspect of breakout trading cannot be overstated. Breakouts create some of the strongest emotional reactions among traders, making psychological discipline absolutely critical.
FOMO (Fear Of Missing Out) is particularly dangerous in breakout trading. When you see a strong, violent move, your instinct might be to rush in—but this is typically a recipe for disaster.
Always have a plan before the breakout appears. Wait for your specific setup criteria to be met before entering. This disciplined approach will save you from countless poor entries driven by emotion rather than strategy.
Discipline is crucial for breakout trading success. Before taking any trade:
Many traders have solid breakout strategies but fail in execution due to psychological factors. Even the perfect breakout strategy is worthless if your psychology leads you to abandon your plan mid-trade.
No breakout strategy works 100% of the time. Accept that some percentage of your breakout trades will fail—this is an unavoidable reality of trading.
The key to long-term success is not avoiding all fakeouts (impossible) but implementing proper risk management so that when fakeouts do occur, the damage is minimal. This means:
Remember, successful breakout trading is more about psychology than perfect technical analysis. By controlling your emotions, following your plan with discipline, and accepting that some trades will fail, you can achieve consistent results even in the most volatile markets.
The psychological aspect of breakout trading cannot be overstated. Breakouts create some of the strongest emotional reactions among traders, making psychological discipline absolutely critical.
FOMO (Fear Of Missing Out) is particularly dangerous in breakout trading. When you see a strong, violent move, your instinct might be to rush in—but this is typically a recipe for disaster.
Always have a plan before the breakout appears. Wait for your specific setup criteria to be met before entering. This disciplined approach will save you from countless poor entries driven by emotion rather than strategy.
Discipline is crucial for breakout trading success. Before taking any trade:
Define your exact entry criteria
Determine your precise stop-loss level
Set clear profit targets
Follow your trading rules without exception
Many traders have solid breakout strategies but fail in execution due to psychological factors. Even the perfect breakout strategy is worthless if your psychology leads you to abandon your plan mid-trade.
No breakout strategy works 100% of the time. Accept that some percentage of your breakout trades will fail—this is an unavoidable reality of trading.
The key to long-term success is not avoiding all fakeouts (impossible) but implementing proper risk management so that when fakeouts do occur, the damage is minimal. This means:
Always using appropriate position sizing
Never risking more than you're comfortable losing on a single trade
Setting stop-losses based on technical levels, not arbitrary dollar amounts
Maintaining a positive expectancy across your trading system
Proper risk management is essential for successful breakout trading. Even the best breakout strategy will fail without these critical safeguards in place.
Never risk more than 1-2% of your trading capital on any single breakout trade. This ensures that even a string of fakeouts won't significantly damage your account.
For breakout trades, place your stop-loss:
Your stop should be placed at a logical level where, if reached, your breakout thesis is clearly invalidated.
Always aim for a minimum 2:1 risk-to-reward ratio on breakout trades. This means your potential profit should be at least twice your potential loss.
With a 2:1 reward-to-risk ratio, even if only 40% of your breakout trades succeed, you can still be profitable overall.
Consider taking partial profits when the price reaches 1:1 risk-to-reward, then moving your stop-loss to breakeven. This approach:
Bybit offers powerful tools designed specifically for breakout trading risk management, helping you execute these principles with precision:
Proper risk management is essential for successful breakout trading. Here are some specific guidelines:
Never risk more than 1-2% of your trading capital on any single breakout trade. This ensures that even a string of fakeouts won't significantly damage your account.
For breakout trades, place your stop-loss:
Below the pattern (for upward breakouts)
At the lowest point of the pattern
Below a significant recent low
Your stop should be placed at a logical level where, if reached, your breakout thesis is clearly invalidated.
Always aim for a minimum 2:1 risk-to-reward ratio on breakout trades. This means your potential profit should be at least twice your potential loss.
With this ratio, even if only 40% of your breakout trades succeed, you can still be profitable overall.
Consider taking partial profits when the price reaches 1:1 risk-to-reward, then moving your stop-loss to breakeven. This approach:
Locks in some profit
Reduces emotional attachment to the trade
Allows you to let the remainder run for potentially larger gains
Don't rely on a single timeframe when trading breakouts. Always verify that the breakout aligns with the larger trend on higher timeframes.
For example, if trading a breakout on the 15-minute chart, confirm that the 1-hour and 4-hour trends support your directional bias. Trading breakouts with the larger trend significantly increases your probability of success.
The most powerful breakouts occur when multiple technical factors align. Look for breakouts that coincide with:
Key support/resistance levels
Moving average crossovers
Oscillator divergences
Round psychological numbers
Fibonacci levels
When multiple technical factors converge at a breakout point, the probability of a successful trade increases dramatically.
For day traders, the timing of breakouts matters significantly. The most reliable breakouts often occur:
During the first hour of major market sessions (especially the New York open)
During high-volume, high-liquidity periods
After significant news or data releases
Conversely, be extremely cautious with breakouts that occur:
During lunch hours when volume typically dries up
In the final hour of trading (which can feature unpredictable closing dynamics)
During holiday periods with thin market participation
A breakout is when price moves outside a defined support or resistance level with increased momentum, signaling a potential new trend. A fakeout looks similar initially but quickly reverses back into the range, failing to sustain the move. The key difference is that genuine breakouts are typically accompanied by increased volume and strong momentum candles, while fakeouts usually lack these confirming factors.
Volume is critical for breakout trading success—it's arguably the #1 indicator that separates real breakouts from fakeouts. A genuine breakout typically shows a significant volume increase at the breakout point, confirming there's real buying/selling pressure behind the move. Trading breakouts without volume confirmation significantly increases your risk of being caught in fakeouts.
Both approaches can be successful if implemented consistently. Entering immediately on the breakout allows you to capture the full move but comes with a higher risk of fakeouts. Waiting for a retest (where old resistance becomes new support or vice versa) provides higher probability setups but you might miss strong moves that never pull back. Your choice should align with your risk tolerance and trading style.
For breakout trades, limit risk to 1-2% of your trading capital per trade. Place your stop-loss at a logical level where your breakout thesis is invalidated—typically below the pattern (for upward breakouts) or at the pattern's lowest point. Aim for a minimum 2:1 risk-to-reward ratio, and consider taking partial profits when the price reaches 1:1 risk-to-reward, then moving your stop-loss to breakeven.
To avoid fakeout traps: 1) Wait for volume confirmation—real breakouts show increased volume; 2) Look for momentum candles that are significantly larger than previous candles; 3) Use multi-timeframe analysis to confirm the breakout aligns with the larger trend; 4) Be patient and wait for your specific setup criteria rather than chasing price action due to FOMO; and 5) Always use proper stop-losses to limit potential damage when fakeouts do occur.
The most reliable breakout patterns include: symmetrical triangles, ascending and descending triangles, bull and bear flags, rectangular consolidations (ranges), cup and handle patterns, and double/triple tops or bottoms. These patterns represent periods of consolidation before potential expansion and provide clear levels for identifying the exact breakout points. Triangles and flags tend to be particularly reliable when they form after strong trend moves.
Breakout trading offers tremendous opportunities for profit when approached correctly. By focusing on chart patterns, volume confirmation, breakout candle analysis, and proper psychology, you can significantly improve your breakout trading results.
Remember that the key differentiator between professionals and amateurs in breakout trading isn't just the entry—it's the ability to quickly recognize and exit failed breakouts while letting winning breakouts run. This balance of decisiveness and patience is what leads to consistent profitability.
Start by practicing these strategies on demo accounts or with small position sizes. Document your results and refine your approach based on what works best for your trading style and the specific markets you trade. With time and experience, you'll develop an intuitive sense for which breakouts are likely to succeed and which are probable fakeouts.
If you've found these strategies valuable, consider deepening your knowledge with my full chart patterns course, which provides even more detail on identifying high-probability trading setups.
What breakout trading strategies have worked best for you? Share your experiences in the comments below!
Disclaimer: Trading involves risk. This content is for educational purposes only and is not financial advice. Always conduct your own analysis and trade according to your personal risk tolerance.
Learn to use TradingView's powerful breakout indicators to spot high-probability trading opportunities in any market.
Master these critical market structure concepts to identify potential trend changes before they become obvious to the average trader.
Discover how institutional traders create fakeouts to hunt liquidity and how you can avoid these traps while capitalizing on the moves that follow.
Learn how to classify support and resistance levels to identify the highest probability breakout trading opportunities with minimal risk.
I bought my first stock at 16, and since then, financial markets have fascinated me. Understanding how human behavior shapes market structure and price action is both intellectually and financially rewarding.
I’ve always loved teaching—helping people have their “aha moments” is an amazing feeling. That’s why I created Mind Math Money to share insights on trading, technical analysis, and finance.
Over the years, I’ve built a community of over 200,000 YouTube followers, all striving to become better traders. Check out my YouTube channel for more insights and tutorials.