The 5 Best TradingView Support & Resistance Tools for Accurate Technical Analysis (2025)
Discover why most of TradingView's support and resistance tools aren't worth your time. Learn to master the trend line tool with a little-known keyboard shortcut, create perfect trend channels, and use rectangles instead of horizontal lines for more accurate zone identification. Plus, unlock the power of the Pivot Points High Low indicator - my secret weapon for precisely identifying key market levels across any timeframe.

Master Support and Resistance Trading: Complete Guide for All Markets (2025)
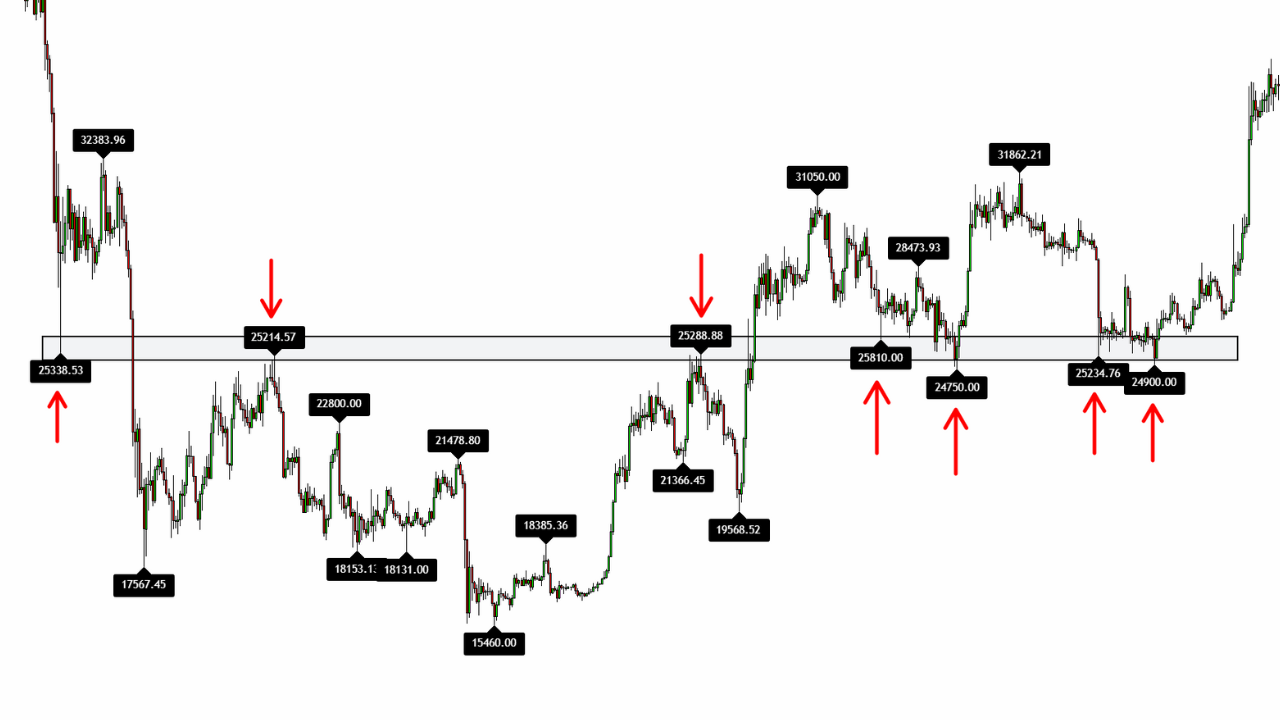
Support and resistance trading is the foundation of technical analysis across all markets. These zones (not exact lines) act as floors and ceilings where price typically reverses. Master identifying them correctly, predicting breaks and bounces, and using powerful indicators to enhance your trading strategy.

The Pivot Point Trading Strategy: How to use the TradingView Pivot Point Indicator
Pivot points are a powerful tool in technical analysis, helping traders identify key support and resistance levels in the market. This guide explores how to use the Pivot Points High Low indicator on TradingView, offering step-by-step instructions, practical examples, and tips for configuring the indicator to maximize its effectiveness.

Support and Resistance TradingView Indicator: The Pivot Point Trading Strategy
The Pivot Points High and Low Indicator is one of the most effective tools on TradingView for identifying key support and resistance levels. In this article, you'll learn how to set it up and use it step-by-step to potentially improve your trading strategy.
