
What is Liquidity in Trading: A Complete Guide to Liquidity Grabs & Sweeps
Master the fundamentals of liquidity in trading - the essential foundation for understanding sweeps and grabs.
Last Updated: December 4, 2025
Watch me explain liquidity sweep trading strategies with real chart examples. In this YouTube video, I cover: what liquidity sweeps are, how smart money hunts stop losses, the difference between sweeps vs grabs, and a complete step-by-step trading strategy including entry rules, stop placement, and profit targets. Perfect visual companion to this article!
Liquidity sweeps are a sophisticated strategy where institutional traders deliberately trigger stop losses to fill their large orders at better prices
Liquidity grabs happen quickly with single wicks, while liquidity sweeps unfold over multiple candles in a more methodical process
Support and resistance levels with multiple touches create perfect hunting grounds for smart money to execute liquidity sweeps
Successful liquidity sweep trading requires waiting for confirmation, placing stops below the sweep extreme, and maintaining at least a 2:1 risk-reward ratio
The key to profiting from liquidity sweeps is thinking like institutional traders - viewing stop losses as liquidity pools rather than exit points
You've experienced it before - that perfect setup appears on your chart, you enter your trade with confidence, and within seconds, you're stopped out. Sound familiar? This frustrating experience happens because you're not seeing what smart money sees. The institutional traders who move markets have a completely different view of price action, and they're using sophisticated techniques like liquidity sweeps to profit from retail traders' predictable behavior.
In this comprehensive guide, I'll reveal exactly how institutional traders use liquidity sweeps to make money from your stop losses, and more importantly, how you can start trading alongside them instead of against them. By understanding these concepts, you'll transform from being the hunted to joining the hunters in the forex and trading markets.
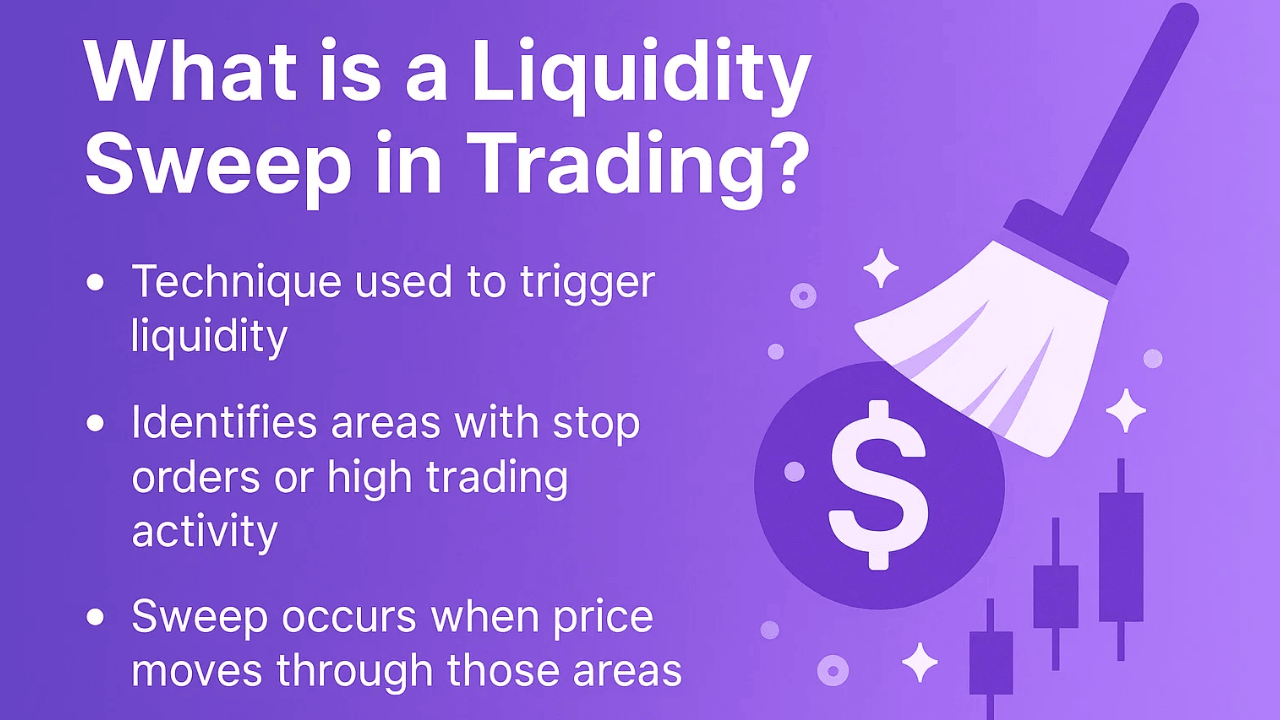
What is a Liquidity Sweep in Trading?
Before diving into liquidity sweeps, it's crucial to understand what liquidity means in trading. Liquidity represents the ease with which an asset can be bought or sold without causing significant price movement. In forex and other markets, liquidity pools form at predictable locations where retail traders place their orders.
Liquidity = How easily an asset can be traded without moving the price
Bank needs to buy $10M
Needs matching sell orders
Targets retail stop losses
📊 Spot liquidity pools like a pro with TradingView's advanced charting - See exactly where smart money is hunting!
Liquidity typically accumulates at:
Previous swing highs and lows
Round psychological numbers (1.2000, 100.00, etc.)
Moving average confluences
These areas attract stop losses and pending orders from retail traders following common trading strategies. Smart money traders know exactly where these orders sit and deliberately target them.
Large institutional traders face a unique challenge - they need to fill massive orders without moving the market against themselves. When a bank wants to buy millions worth of currency, they can't simply hit the buy button like retail traders. They need sufficient sell orders (liquidity) to fill their positions. This is where retail stop losses become valuable.
One of the most important distinctions in smart money trading is understanding the difference between a liquidity sweep and a liquidity grab. While both involve taking out stop losses, they manifest differently on your charts and require different trading approaches.
A liquidity grab is the more aggressive cousin of the liquidity sweep. Its defining features include:
Single candle spike - Often appears as a long wick
Rapid reversal - Price quickly returns to the original range
Violent movement - Happens within minutes or even seconds
Clear rejection - Shows immediate selling or buying pressure
Think of a liquidity grab as a sniper shot - quick, precise, and devastating to those caught off guard. These moves often occur during low-liquidity sessions or around major news events when spreads widen.
In contrast, a liquidity sweep is a more methodical process. As I demonstrated in the trading example, liquidity sweeps involve:
Multiple candles - The sweep unfolds over several periods
Gradual movement - Price slowly grinds through the liquidity zone
Sustained pressure - Appears more like genuine selling or buying
Deeper penetration - Often moves further beyond the liquidity zone
The liquidity sweep is like a chess game - calculated, patient, and strategic. Smart money uses this approach when they need to accumulate larger positions without alerting the market to their intentions.
Enter on the same candle close or next candle open. Requires fast execution. Stop below wick extreme.
Wait for reversal confirmation candle. More time to analyze. Stop below sweep extreme with buffer.
Key Insight: Grabs are like sniper shots—fast and precise. Sweeps are like chess games—calculated and patient. Both target the same liquidity, but require different execution timing.
Let me walk you through a practical example of how smart money executes a liquidity sweep at support levels. This strategy capitalizes on retail traders' predictable behavior of placing stop losses just below support.
In the example I analyzed, we had a clear support level that showed:
Multiple bounces from the same price zone
Visible demand coming in at each test
Two successful retests confirming the level's validity
This creates the perfect hunting ground for institutional traders. Why? Because retail traders who bought at these bounces likely placed their stop losses just below support - exactly where textbook trading strategies suggest.
Here's how smart money orchestrates the sweep:
Identify the liquidity pool - They know stops are clustered below support
Push price down gradually - Using their size to overwhelm buyers
Trigger stop losses - Creating a cascade of sell orders
Absorb the selling - Using retail stops to fill their buy orders
Reverse direction - Once liquidity is captured, price moves higher
For this liquidity sweep setup, my approach is straightforward:
Entry Options:
Enter at the candle close after the sweep
Wait for one confirmation candle above support
Use limit orders at the extreme of the sweep
Stop Loss Placement:
Always below the extreme of the liquidity sweep
Add a buffer for market noise (5-10 pips in forex)
Never place stops where others do
Profit Targets:
Use a minimum 2:1 risk-to-reward ratio
Target the next liquidity pool or resistance
Consider scaling out at key levels
Trading liquidity sweeps requires a shift in mindset from traditional technical analysis. Instead of seeing support breaks as bearish, you need to recognize them as potential buying opportunities. Here's a comprehensive approach to trading these setups.
Mindset Shift: Support breaks = Buying opportunities, not bearish signals!
Master liquidity sweeps with professional-grade trading tools!
Trade on Bybit Up to $30,000 BonusBybit: Advanced DOM & order flow tools to spot institutional liquidity hunts
Before a liquidity sweep occurs, look for these warning signs:
Extended consolidation at support or resistance
Decreasing volume as price approaches the level
Multiple tests without a clean break
Obvious stop loss zones visible on the chart
Step 1: Mark Your Levels Identify key support and resistance levels where liquidity likely sits. Focus on:
Levels tested multiple times
Areas with clear rejections
Zones where retail traders entered
Step 2: Wait for the Sweep Patience is crucial. Don't try to catch a falling knife. Instead:
Let price sweep the liquidity
Observe the character of the move
Look for absorption signs
Step 3: Execute Your Trade Once the sweep completes:
Enter on reversal confirmation
Place stops beyond the sweep extreme
Set realistic profit targets
For more sophisticated trading, consider these advanced concepts:
Multi-Timeframe Analysis
Identify liquidity on higher timeframes
Execute entries on lower timeframes
Align sweeps with overall market structure
Volume Analysis
Look for volume spikes during sweeps
Confirm with volume divergence
Use volume profile for better entries
Order Flow Confirmation
Monitor DOM (Depth of Market) if available
Watch for large order absorption
Identify institutional footprints
Understanding what not to do is just as important as knowing the right approach. Here are the most costly mistakes I see traders make when attempting to trade liquidity sweeps.
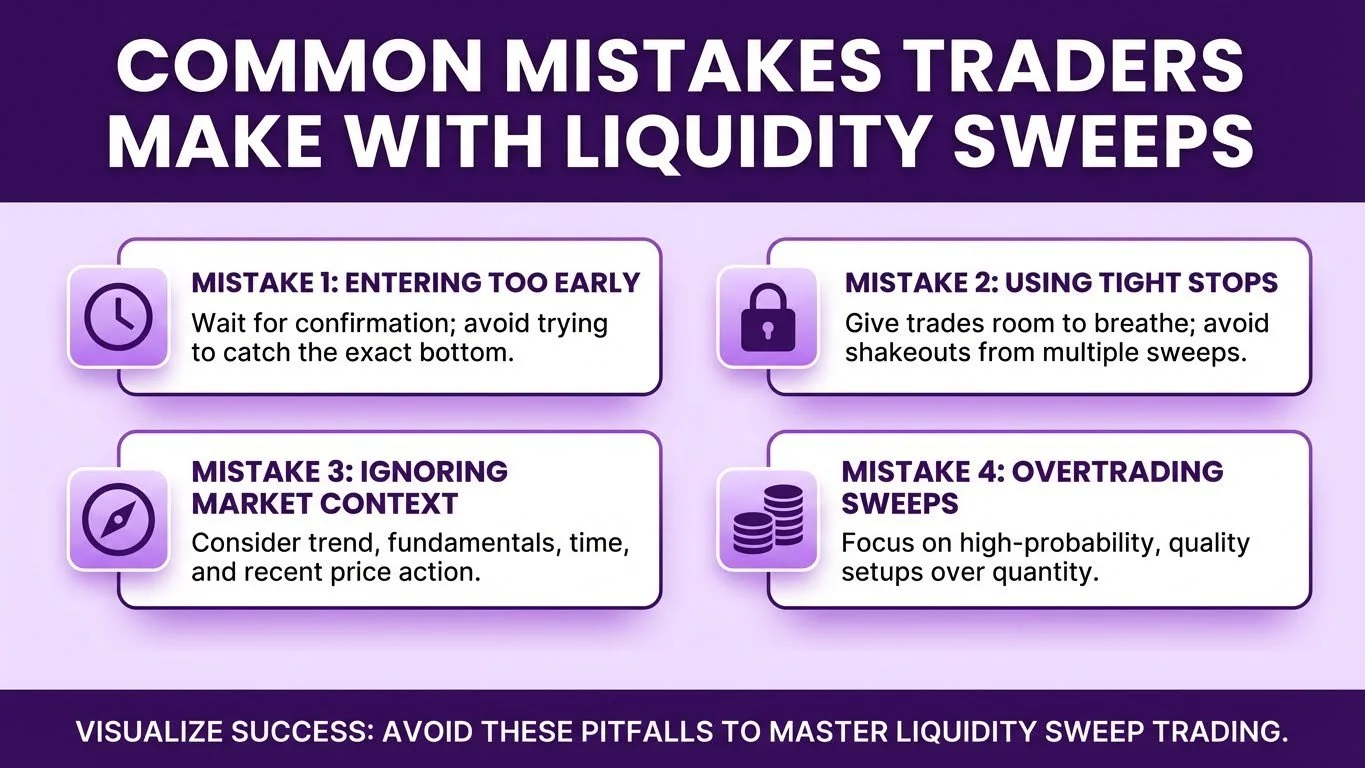
Common Liquidity Sweep Mistakes
Many traders try to catch the exact bottom of a sweep. This "hero trading" often results in multiple stop-outs. Remember, smart money can push price further than you expect. Wait for confirmation rather than trying to predict the exact turning point.
Placing stops too close to your entry invites trouble. Smart money often conducts multiple sweeps or creates choppy price action to shake out weak hands. Give your trades room to breathe while maintaining proper risk management.
Not every support break is a liquidity sweep. Consider:
Overall market trend
Fundamental catalysts
Time of day and session
Recent price action context
Just because you understand liquidity sweeps doesn't mean every setup is tradeable. Quality over quantity always wins. Focus on high-probability setups with clear liquidity pools and strong market structure.
Proper risk management separates profitable traders from those who blow up their accounts. When trading liquidity sweeps, these principles become even more critical.
Never risk more than 1-2% per trade
Reduce size in volatile conditions
Scale into positions when appropriate
Account for wider stops in your calculations
As demonstrated in my example, maintaining at least a 2:1 risk-to-reward ratio is essential. This means:
If risking 20 pips, target 40 pips minimum
Account for spread and commissions
Be realistic about target placement
Consider partial profits at 1:1
Trading liquidity sweeps can be mentally challenging. You're buying when others are selling and vice versa. Protect your psychological capital by:
Starting with smaller positions
Keeping a detailed trading journal
Taking breaks after successive losses
Celebrating process over outcomes
Liquidity sweeps occur across all financial markets. Let me share how these concepts apply beyond forex trading.
In stocks, liquidity sweeps often occur at:
Previous day's low/high
Weekly opening ranges
Earnings announcement levels
Major moving averages
The principle remains the same - institutional traders hunt obvious stop-loss levels before reversing direction.
Crypto markets, with their 24/7 nature and high retail participation, offer numerous liquidity sweep opportunities:
Weekend stop hunts
Funding rate squeezes
Liquidation cascades
Exchange-specific sweeps
Professional futures traders regularly exploit liquidity in:
Overnight gaps
Contract rollover periods
Economic data releases
Options expiry levels
While price action remains king, certain tools can help identify and confirm liquidity sweep setups.
False breakdowns before markup
Multiple tests of support/resistance
Tightening ranges before expansion
Quick reversals after breaks
Get all these professional tools in one platform!
📈Volume Profile
Shows where most trading occurred
Identifies high-volume nodes
Reveals institutional activity zones
Market Profile
Displays time spent at each price
Highlights value areas
Shows market acceptance/rejection
Order Flow Tools
Delta analysis
Cumulative volume delta
Watch for these patterns before liquidity sweeps:
Wyckoff Springs - False breakdowns before markup
Triple/Quadruple Taps - Multiple tests of support/resistance
Compression Patterns - Tightening ranges before expansion
Failed Breakouts - Quick reversals after breaks
Modern trading platforms offer features that help identify liquidity:
Heat maps showing order clusters
Level 2 data for stock traders
Commitment of Traders (COT) reports
Options flow for underlying direction
Now that you understand the concepts, let's build a complete trading strategy you can implement immediately.
1. Market Selection
Choose liquid markets with clear levels
Focus on 1-3 markets initially
Understand each market's characteristics
2. Timeframe Selection
Higher timeframes for level identification
Lower timeframes for entry precision
Match timeframes to your availability
3. Setup Criteria Create a checklist:
Clear support/resistance identified
Multiple touches confirming level
Obvious stop loss zone present
No major news events pending
Market structure supports reversal
4. Entry Rules
Wait for complete liquidity sweep
Confirm with reversal candle
Enter on retest or momentum
5. Exit Strategy
Initial stop below/above sweep extreme
First target at 1:1 risk-reward
Trail stops after 1:1 achieved
Final target at next liquidity zone
Before risking real capital:
Test on historical data
Journal every setup
Calculate win rate and expectancy
Refine rules based on results
Start with demo trading
The markets evolve, and so should your strategy:
Review trades weekly
Identify pattern variations
Adjust to market conditions
Learn from both wins and losses
Connect with other traders
Understanding why liquidity sweeps work requires diving into market psychology and the fundamental differences between retail and institutional thinking.
Retail traders often:
Follow obvious technical analysis rules
Place stops at predictable levels
React emotionally to price movements
Trade with the crowd
Focus on being "right" rather than profitable
This predictable behavior creates the very opportunities smart money exploits.
Institutional traders think differently:
They need liquidity to fill large orders
View stop losses as pending orders
Plan moves well in advance
Trade against the crowd
Focus on execution over prediction
To trade like smart money:
Question the obvious - If a level is too clear, it's a target
Embrace discomfort - The best trades feel uncomfortable
Think in probabilities - No setup works 100% of the time
Focus on process - Perfect execution over perfect prediction
Manage emotions - Stay calm during sweeps
A liquidity sweep is a temporary move beyond support or resistance designed to trigger stop losses before reversing, while a normal breakout continues in the direction of the break. Liquidity sweeps show immediate rejection and return to the original range, whereas genuine breakouts establish new trading ranges. The key is watching for rapid reversals and absorption of the triggered orders.
Wait for at least one full candle to close back within the original range or above/below the swept level. Some traders prefer waiting for a second confirmation candle or a retest of the level. The exact timing depends on your timeframe - on a 15-minute chart, this might be 15-30 minutes, while on a 4-hour chart, you might wait 4-8 hours for proper confirmation.
Yes, not every liquidity sweep leads to a reversal. Sometimes the market continues in the direction of the sweep, indicating genuine selling or buying pressure. Protect yourself by always using stop losses below the extreme of the sweep, limiting position size to 1-2% risk per trade, and avoiding trades during major news events when false signals are common.
Liquidity sweeps occur on all timeframes, but the most reliable setups often appear on 1-hour to daily charts. Higher timeframes provide more significant liquidity pools and clearer market structure. Use higher timeframes to identify levels and lower timeframes (15-minute to 1-hour) for precise entries. Avoid timeframes below 15 minutes unless you're an experienced scalper.
Look for these key differences: Liquidity sweeps show rapid rejection with increased volume on the reversal, occur at obvious technical levels with clear stop loss zones, happen during low-liquidity sessions or at session opens, and lack fundamental catalysts for the move. Genuine weakness shows sustained selling pressure, breaks multiple support levels, is accompanied by negative news or sentiment, and maintains momentum without immediate reversal.
While price action is most important, helpful indicators include Volume (look for spikes during the sweep and reversal), Volume Profile (identifies high-volume nodes and liquidity zones), RSI or Stochastic divergences at extremes, and Order Flow tools if available. However, don't rely solely on indicators - they should confirm what price action already suggests.
Mastering liquidity sweep trading strategies transforms how you view the markets. Instead of being frustrated when stopped out, you'll recognize these moments as potential opportunities. The key is shifting your perspective from retail thinking to understanding how institutional traders operate.
Remember, not every support break is a liquidity sweep, and not every sweep leads to a profitable reversal. Success comes from properly identifying high-probability setups, managing risk effectively, and executing with discipline. Start small, focus on one market, and gradually build your expertise.
The markets are designed to transfer money from the impatient to the patient, from the emotional to the disciplined. By understanding liquidity sweeps, you're taking a crucial step toward trading alongside smart money rather than being their liquidity.
Disclaimer: This content is for educational and informational purposes only. Trading carries substantial risk, and you should never trade with money you cannot afford to lose. Always conduct your own research and consider seeking advice from a qualified financial advisor.
Master the fundamentals of liquidity in trading - the essential foundation for understanding sweeps and grabs.
Learn the faster, more aggressive cousin of liquidity sweeps - master single-wick grabs for quick profits.
Understand the market structure concepts that help identify when liquidity sweeps are most likely to occur.
Identify which price levels are most vulnerable to liquidity sweeps based on their strength characteristics.
Trading & Investing Enthusiast
Teaching traders to understand market psychology, technical analysis, and investing through clear beginner-friendly insights.
Started investing at 16 and became fascinated by how market psychology influences price movements. Still learning something new every day.
Love sharing what I've learned along the way. There's nothing quite like helping someone understand a concept that once confused me too.
Proud to have built a community where traders actively share insights and grow together through daily market analysis and discussion.
Want to join our learning journey?
See where institutional traders hunt stops & turn liquidity sweeps into profit opportunities