
The Psychology of Trading: Why Traders Lose Money - Mark Douglas's Insights
Discover the psychological barriers that cause 90% of traders to fail and learn proven mental strategies for consistent profitability.
If you prefer video over text, don't worry. In this YouTube video, you will learn everything you need to know about market cycles for trading and investing. I'll show you all 14 market phases, how to spot them using tools like the VIX, and why understanding these cycles can help you avoid buying at tops and selling at bottoms.
Market cycles are repeating patterns of rising, peaking, falling, and bottoming prices driven by human emotion, economic trends, and institutional behavior
Most traders lose money by buying during the euphoria phase (market tops) and selling during panic or depression phases (market bottoms)
The market cycle consists of 14 distinct emotional phases, from disbelief through euphoria to depression, each offering different trading opportunities
Market cycles exist on all timeframes - from minute charts to monthly charts - making this knowledge valuable for both day traders and long-term investors
Tools like the VIX index can help measure market fear and greed, with readings above 50 historically marking excellent buying opportunities
When was the last time you bought near the top or sold near the bottom? If you're totally honest, it was probably recently. But what if I told you that every market cycle actually follows the same emotional pattern? And once you see this pattern, it's very hard to unsee it.
I've been analyzing market cycles across crypto, stocks, and forex for years, and this knowledge has completely transformed how I approach trading. Today, I'm going to share everything I've learned about market cycles - from the psychology that drives them to the practical tools you can use to identify where we are in any given cycle.
Rise → Peak → Fall → Bottom
Emotions • Economy • Institutions
Minutes to Years (Fractal)
All Markets & Assets
Analyze cycles across all timeframes with TradingView's advanced charting tools
Start Free Trial Get 30 days free + $15 bonus with our linkIn simple terms, a market cycle is the repeating pattern of rising, peaking, falling, and bottoming asset prices. You'll find these cycles everywhere - in crypto markets, stock markets, forex markets, and virtually any traded asset.
What makes market cycles particularly fascinating is that they're primarily driven by three key factors:
Human emotion - Fear, greed, hope, and despair
Economic trends - Fundamental shifts in the economy
Institutional behavior - How smart money moves through markets
Here's something that might feel counterintuitive: market cycles exist on multiple timeframes too. Most people only think about long-term cycles when they zoom out on a chart, but you'll actually find these small cycles within larger cycles themselves. This fractal nature of markets means that whether you're a day trader or a long-term investor, understanding cycles can improve your decision-making.
Market cycles matter because they help you understand the bigger picture and avoid making emotional mistakes. Most people lose money by buying late in bull markets or panicking in bear markets.
I've noticed an interesting pattern during my years of trading: when we see massive sell-offs - like what we saw recently with the Trump tariff situation or during COVID - there's always a big increase in volume. This tells us that more people who maybe never even touch their accounts are actually more likely to sell during these times of extreme fear.
Let me ask you this: have you ever sold because you got scared and didn't stick to your plan? If you're nodding your head, you're not alone. This is exactly why understanding market cycles is crucial - it helps improve your:
Timing - Knowing when to enter and exit positions
Risk management - Adjusting position sizes based on cycle phase
Decision making - Making logical rather than emotional choices
Long-term thinking - Seeing beyond short-term volatility
One of the most valuable resources I've come across is the "Psychology of a Market Cycle" chart from Wall Street Cheat Sheet. This schematic representation has helped me understand market movements in a way that pure technical analysis never could.
Remember, this isn't about memorizing exact price patterns - it's about understanding the emotional phases that drive price action. The chart shows how human psychology creates predictable patterns in markets, regardless of the asset being traded.
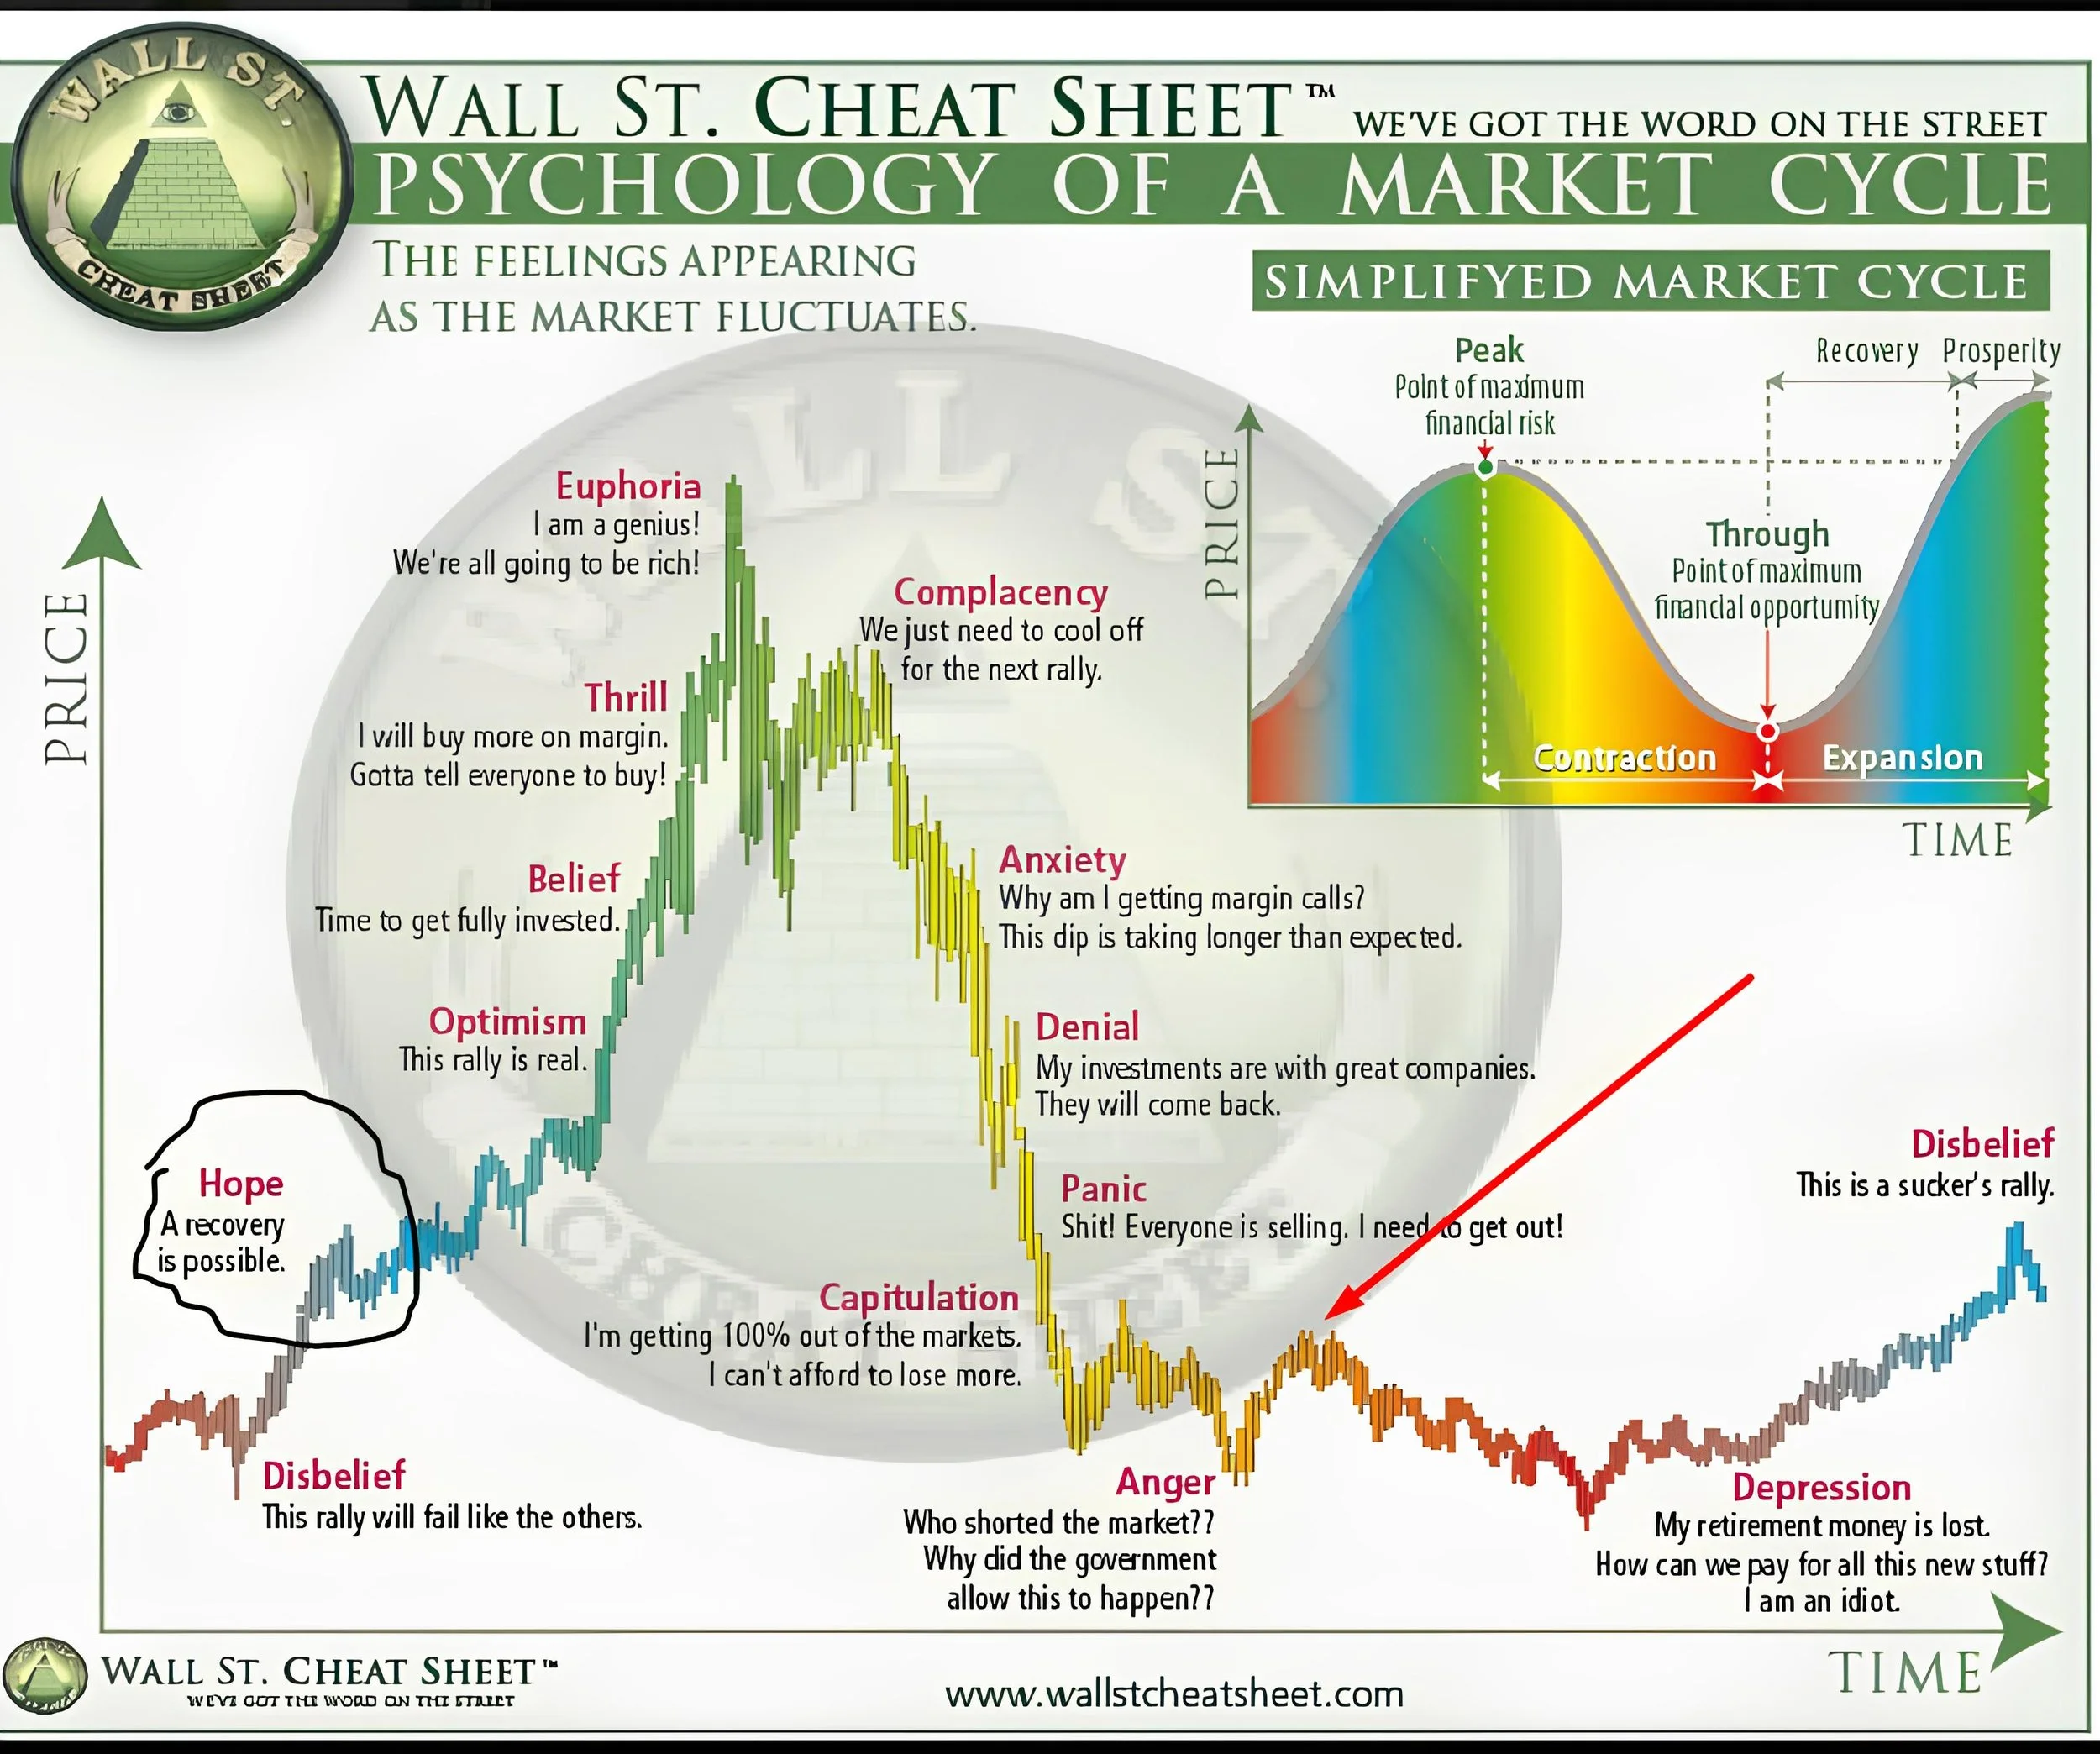
The Psychology of Market Cycles
Let me walk you through each phase of the market cycle, as I've experienced them in my own trading journey:
Profit from both bull and bear markets with advanced trading tools
Start Trading Get up to $30,000 in bonuses + VIP rewardsBig rallies usually start when people have the mindset of "this rally will fail like all others." I've seen this countless times - when Bitcoin was at $3,000 in 2020, most people thought it was just another fake-out. This is actually when the biggest bull markets begin.
As prices break to form slightly new highs, people start thinking recovery is possible. The sentiment shifts from complete negativity to cautious optimism.
The price grinds higher, and people start believing the rally is real. Trading volume increases as more participants enter the market.
This is when people start going all-in. If you think about Bitcoin, this might be when someone with a small position decides to go 100% into crypto. The fear of missing out begins to build.
Here's where it gets wild. People start using margin, borrowing money, or using leverage to buy more than 100% of their position. Prices can increase rapidly, and it's exciting to be part of the action.
This is the danger zone. You'll hear things like "I'm a genius," "I beat the market," or "We're all going to get rich." When your taxi driver starts recommending stocks, or everyone's talking about NFTs (remember that era?), you're likely in the euphoria phase.
After a sharp drop from euphoria, there's usually a bounce. People say, "We just need to cool off" or "We're preparing for the next big rally." But instead of rallying, the market delivers the next leg down.
From both a psychological and technical perspective, this is where we see a change of character in the market structure. People start wondering, "Why am I getting margin calls?" or "This dip is lasting longer than expected."
Investors cling to fundamentals, thinking "My investments have good fundamentals - they'll come back and make new all-time highs eventually."
Reality hits hard. People wonder why everyone is selling despite "good fundamentals." Many think, "I need to get out - I can't handle these emotions anymore."
This is when people completely exit the market, saying "I'm never touching this again" or "Crypto is a scam" (if it's crypto markets). The pain becomes unbearable.
Things get violent emotionally. People blame others, look for conspiracies, ask "Who manipulated the market?" or "Was it the government?" Finger-pointing becomes common.
The saddest phase. People think, "I've lost my money," "I got too caught up in the euphoria." Ironically, this is usually the best time to buy - when sentiment is at its absolute worst.
The cycle begins anew as prices start recovering, but most people believe it's just another fake rally that will fail.
One tool I really like to use to gauge where we are in the market cycle is the VIX index. For my analysis, I use TradingView for pretty much all my technical and fundamental analysis.
The VIX works on a simple principle: the higher the VIX, the more fear in the market. For example:
The recent spike above 50 happened during the Trump tariff drama
Historically, VIX above 50 tends to be a great buying signal
The massive COVID crash spike was one of the best buying opportunities in recent history
The VIX is one of many indicators I use to determine how greedy or fearful the market is at any given time. It's particularly useful for identifying extreme sentiment that often marks major turning points.
Understanding market cycles isn't just theoretical - it has practical applications for every trade you make:
Position Sizing: Reduce position sizes during euphoria phases, increase during depression
Entry Timing: Look for disbelief and depression phases for long-term entries
Exit Strategy: Consider taking profits during thrill and euphoria phases
Risk Management: Tighten stops during complacency and anxiety phases
Remember, these cycles exist on all timeframes. A 4-hour chart might show euphoria while the daily chart shows optimism. This is why multi-timeframe analysis is crucial.
Smart money quietly buys
Uptrend begins
Smart money sells
Downtrend follows
Use volume profiles & advanced indicators to spot smart money moves
Analyze Charts FreeWhile the psychology of market cycles gives us the emotional framework, Wyckoff's market cycle theory provides the technical structure. Wyckoff identified four main phases:
Accumulation (smart money buying)
Markup (uptrend)
Distribution (smart money selling)
Markdown (downtrend)
These phases align perfectly with the psychological phases we've discussed, giving traders a complete picture of market dynamics.
Through my trading journey, I've identified several common mistakes traders make with market cycles:
Trying to time the exact top or bottom - Focus on phases, not precise points
Ignoring smaller timeframe cycles - Remember cycles exist on all timeframes
Fighting the cycle - Don't try to be contrarian just for the sake of it
Emotional attachment - Stay objective about which phase we're in
One-size-fits-all approach - Different markets may be in different phases
While I can't predict the future, understanding market cycles helps us assess current conditions more objectively. Look at social media sentiment, mainstream media coverage, and tools like the VIX to gauge where we might be in the cycle.
Ask yourself:
What are people saying about the market?
Is there widespread euphoria or depression?
Are new investors flooding in or capitulating?
What's the VIX telling us about fear levels?
Different cycle phases require different risk management approaches:
Disbelief to Optimism: Can afford larger position sizes with wider stops
Belief to Euphoria: Reduce position sizes, tighten stops, take partial profits
Anxiety to Anger: Preserve capital, wait for clarity
Depression: Begin accumulating with proper risk controls
Never use more leverage than you can afford to lose, regardless of which phase we're in. The market can stay irrational longer than you can stay solvent.
Market cycles vary greatly in duration depending on the timeframe and asset class. In crypto markets, full cycles can last 3-4 years, while stock market cycles may span 5-10 years. However, smaller cycles exist within larger ones - daily traders might see complete cycles within hours or days. The key is recognizing that cycles exist on all timeframes rather than focusing on specific durations.
While market cycles help identify general phases, they cannot predict exact price points. Instead of trying to catch the absolute top or bottom, focus on recognizing the emotional phases. The best opportunities often come from understanding whether we're in a fear-driven phase (good for buying) or greed-driven phase (good for selling), rather than timing exact reversals.
Yes, the psychological pattern remains remarkably consistent across different markets - crypto, stocks, forex, and commodities all exhibit similar emotional cycles. However, the speed and intensity can vary significantly. Crypto markets tend to have more extreme and faster cycles, while traditional stock markets may have more gradual transitions between phases.
No single indicator is perfectly reliable, but combining several approaches works best. The VIX index effectively measures fear in stock markets (readings above 50 often mark bottoms), while social media sentiment and mainstream media coverage provide valuable psychological insights. Technical indicators like RSI and moving averages can confirm cycle phases, but always prioritize understanding market psychology over any single metric.
Start by observing without trading. Watch how sentiment changes on social media during market moves, note when mainstream media covers certain assets, and track your own emotions during price swings. Practice identifying which phase the market might be in using historical charts. Begin with small positions only after you've observed several cycles and can recognize the emotional patterns without being swept up in them.
Understanding market cycles has transformed my approach to trading. Once you recognize these patterns, you'll start seeing them everywhere - from crypto to stocks to forex. The key is to remain objective, use tools like the VIX to confirm your analysis, and always manage your risk appropriately.
Remember, no one can predict the exact tops and bottoms, but understanding the psychological phases of market cycles can help you make better decisions and avoid the emotional traps that cause most traders to buy high and sell low.
If you're serious about improving your trading, I recommend diving deeper into both the psychological aspects we've covered and technical frameworks like Wyckoff theory. Consider joining trading communities where you can discuss these concepts with other serious traders and continue your education.
The market will always cycle between fear and greed, depression and euphoria. Your job as a trader is to recognize these phases and position yourself accordingly. Stay disciplined, stay educated, and most importantly, stay objective about where we are in the cycle.
Disclaimer: This content is for educational purposes only and should not be considered financial advice. Trading involves substantial risk of loss. Always conduct your own research and consider your financial situation before making any investment decisions.
Discover the psychological barriers that cause 90% of traders to fail and learn proven mental strategies for consistent profitability.
Learn how to read market structure like a professional trader and identify high-probability trading opportunities across all timeframes.
Understand how to identify and trade key support and resistance levels that align with market cycle phases.
Learn essential risk management strategies to protect your capital through all phases of market cycles.
Trading & Investing Enthusiast
Teaching traders to understand market psychology, technical analysis, and investing through clear beginner-friendly insights.
Started investing at 16 and became fascinated by how market psychology influences price movements. Still learning something new every day.
Love sharing what I've learned along the way. There's nothing quite like helping someone understand a concept that once confused me too.
Proud to have built a community where traders actively share insights and grow together through daily market analysis and discussion.
Want to join our learning journey?
Stop buying at euphoria and selling at panic - trade all 14 phases profitably