
Break of Structure (BoS) and Change of Character (CHoCH) Trading Strategy
Master the core concepts of BoS and CHoCH to identify key turning points in the market.
Last Updated: January 1, 2026
Prefer watching a YouTube video over reading? In this video, you will learn everything you need to know about smart money concepts trading... from market structure basics to advanced techniques like order blocks, liquidity grabs, and BOS/CHOCH patterns that most traders never discover.
Smart Money Concepts help retail traders identify and follow institutional trading patterns for potentially better trading outcomes.
Master market structure first - understanding higher highs/lows and BOS/CHOCH can improve your trend identification.
Liquidity grabs and sweeps target stop-loss clusters - recognizing these patterns can provide high-probability entry points.
Order blocks reveal institutional footprints - zones where smart money placed significant orders often become future support/resistance.
Risk management and psychology determine long-term success - even perfect setups can fail, so protect your capital and think in probabilities.
If you're serious about trading crypto, stocks, or forex in 2026, understanding Smart Money Concepts (SMC) can be the difference between consistent profits and constant losses. I've spent years studying how institutional traders operate, and in this comprehensive guide, I'll share everything you need to know about SMC trading - including powerful techniques that most traders have never even heard about.
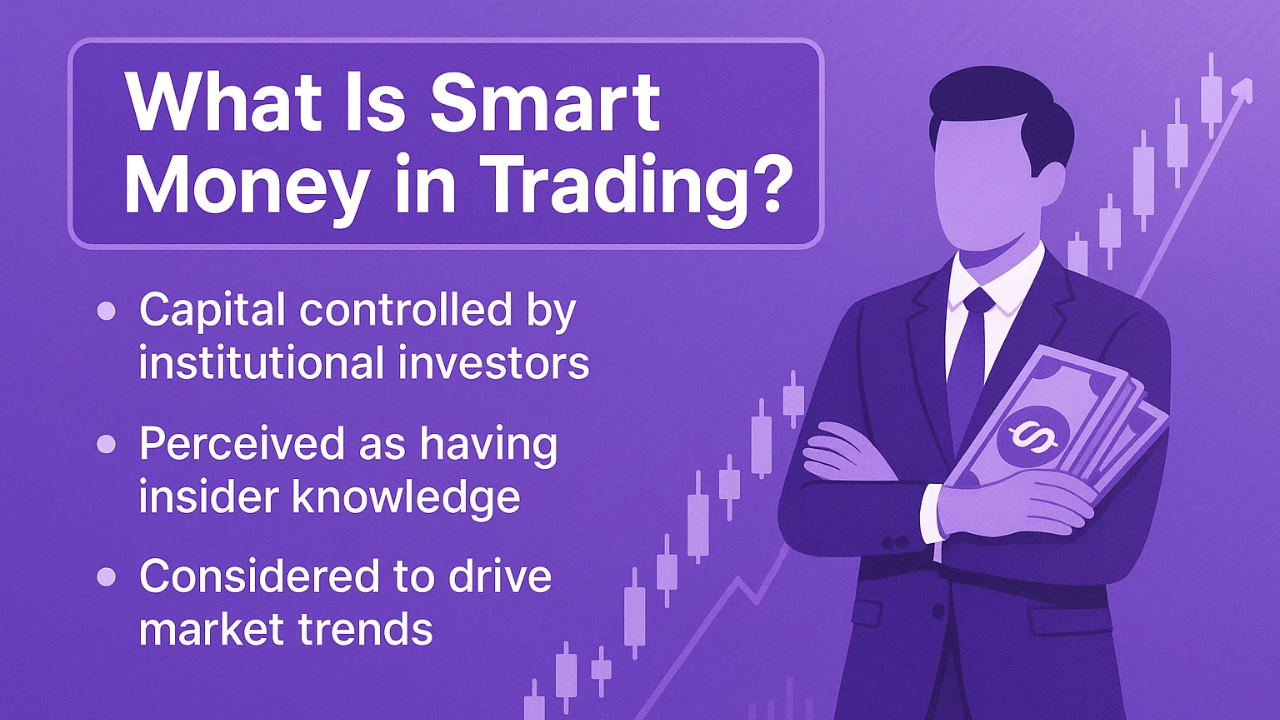
What is Smart Money in Trading?
Smart money refers to large professional investors - the institutions, hedge funds, and banks that move markets with their massive capital. These aren't your average retail traders; they have access to better tools, superior data, and most importantly, enough money to actually influence price movements.
I've observed that smart money traders often create liquidity and manipulate important market levels. When you have billions at your disposal, you can actually move prices - especially in markets with lower liquidity. This isn't conspiracy theory; it's simple market mechanics.
Smart Money Concepts, therefore, is a trading approach focused on identifying and following these big players' behavior. If we can learn how smart money trades - their patterns, their tactics, their favorite setups - we can ride their coattails to profit.
Critical Foundation: Without understanding market structure, all other SMC concepts become useless!
Price moving higher over time
Price moving lower over time
Price moving horizontally in a range
Sideways markets aren't always perfect rectangles!
They can form as triangles, wedges, or broadening patterns - but they're still consolidation phases that often lead to explosive moves.
HH + HL = Buy Signal
LH + LL = Sell Signal
Wait for Breakout
Professional traders use TradingView to identify these patterns instantly on real charts
Try TradingView Free 30-day premium trial + $15 bonusBefore diving into advanced SMC techniques, you must master the basics of market structure. I can't stress this enough - without understanding trend and structure, the other concepts will be useless.
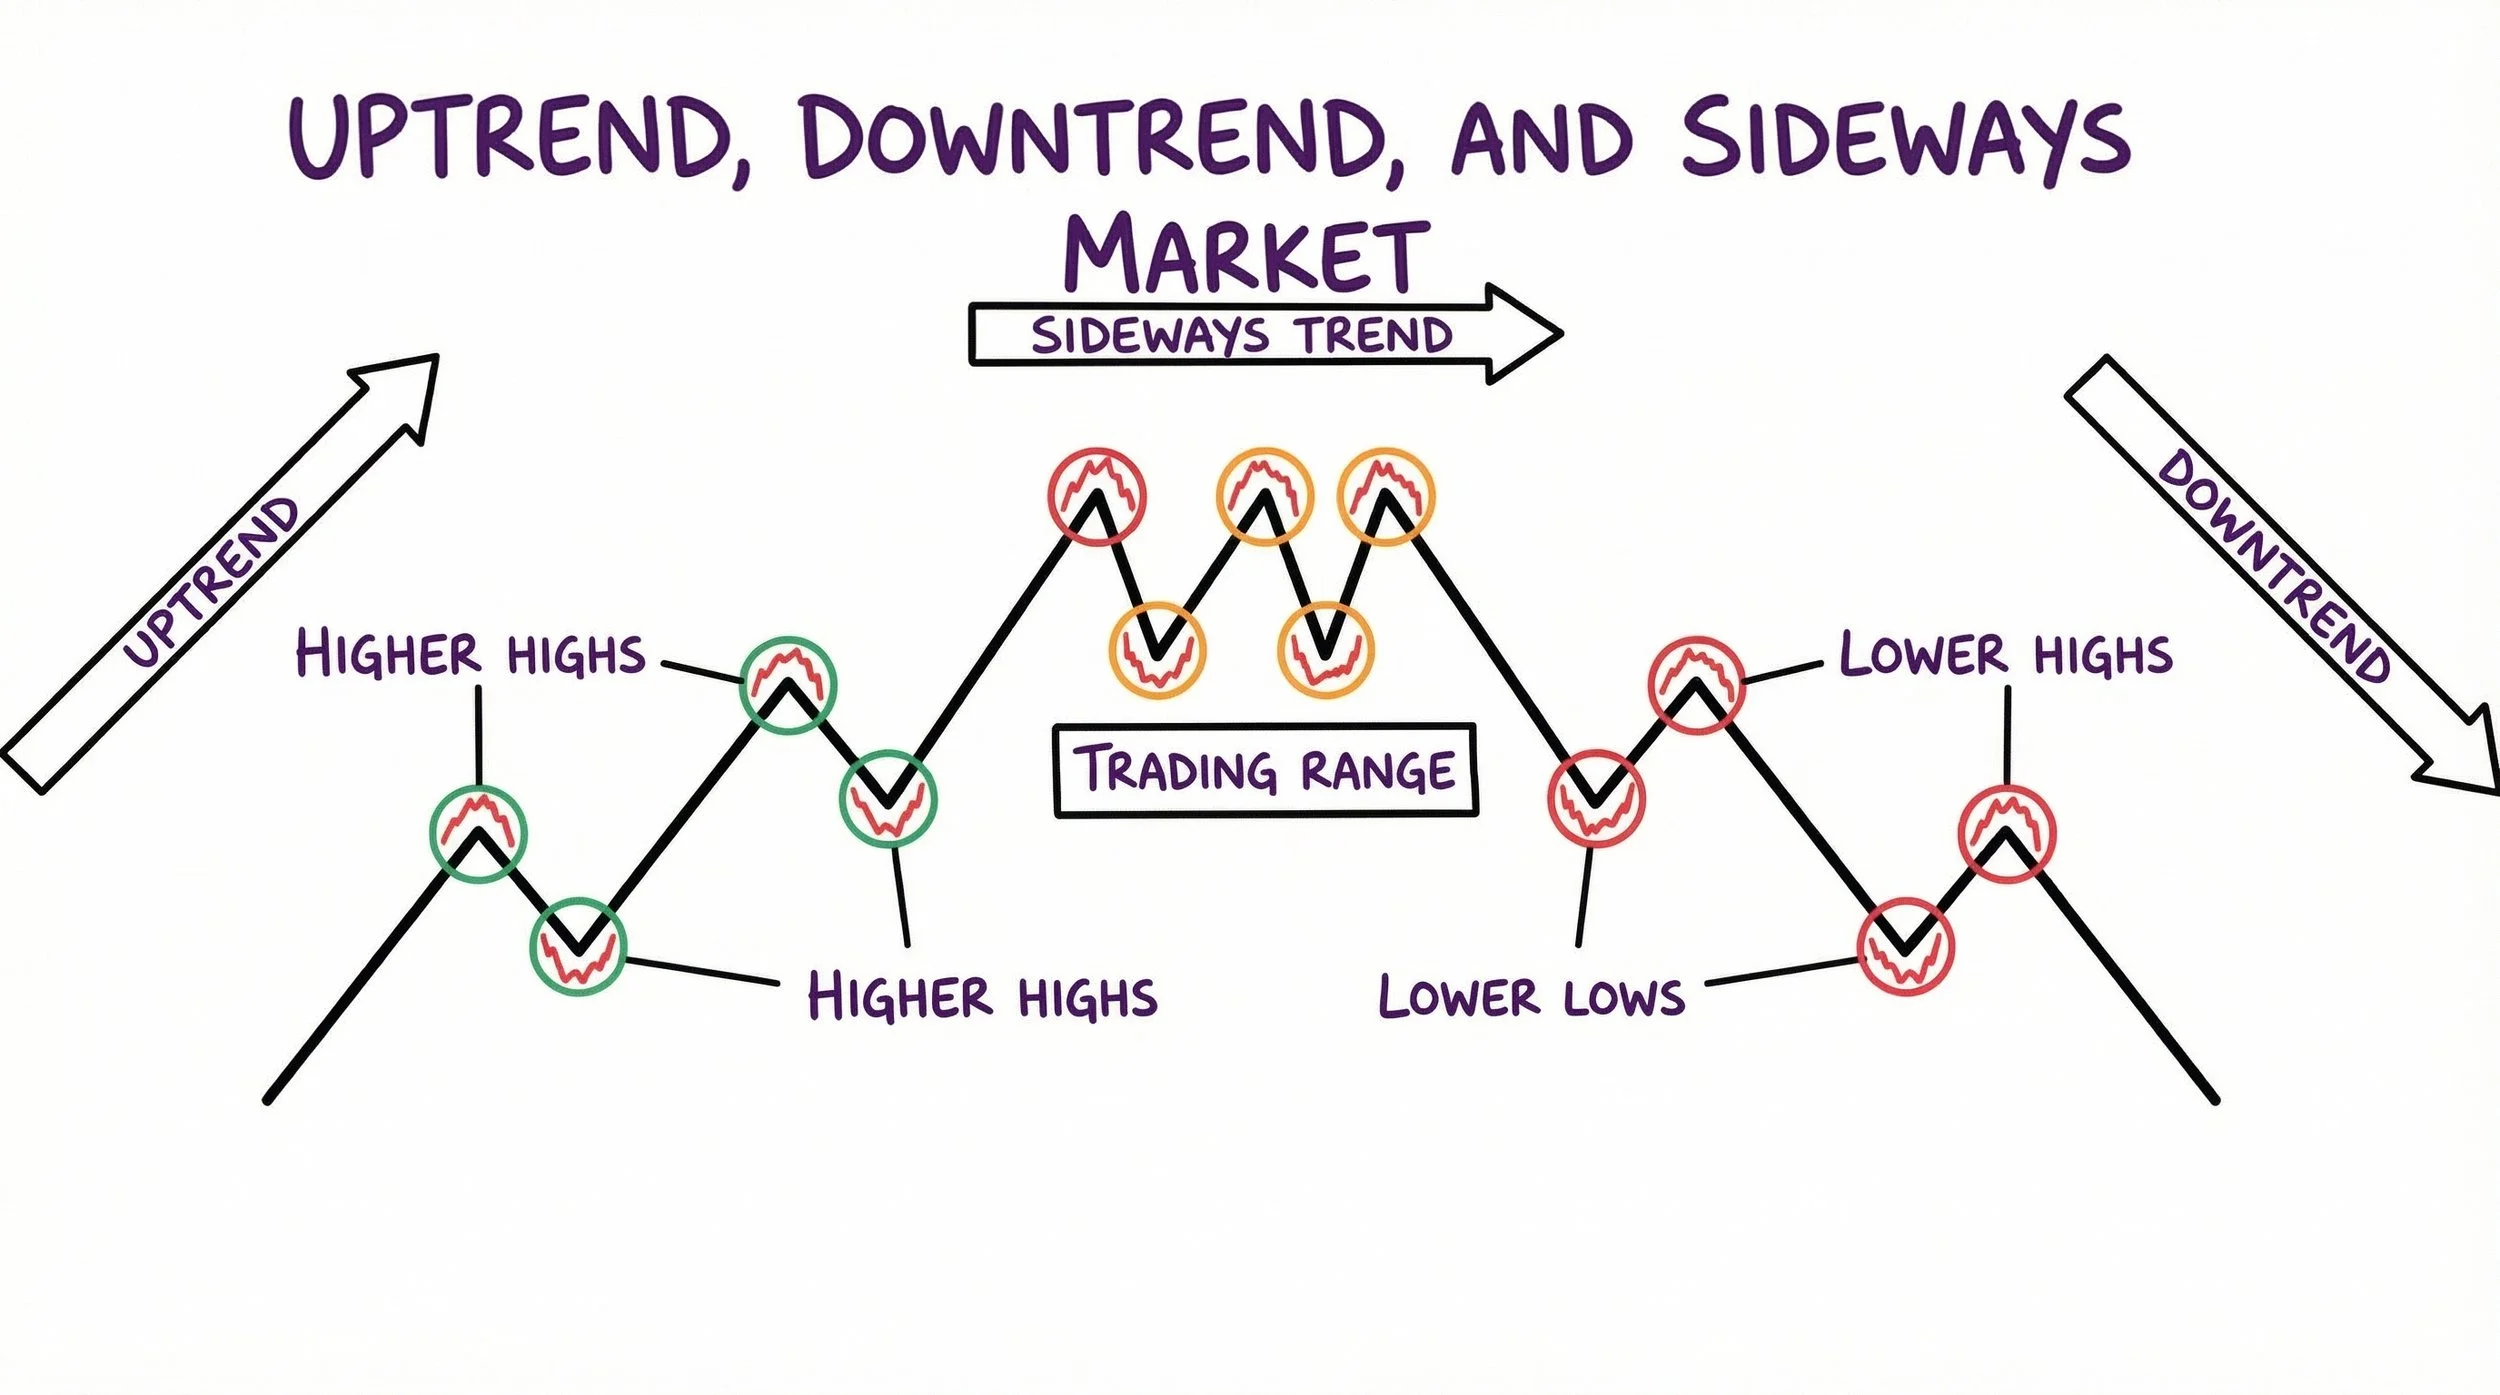
The three market states every trader must recognize: uptrends (higher highs/higher lows), sideways ranges, and downtrends (lower highs/lower lows).
1. Uptrend: Price moving higher over time, characterized by higher highs (HH) and higher lows (HL). This signals buyers are in control and momentum is bullish.
2. Downtrend: Price moving lower over time, showing lower highs (LH) and lower lows (LL). Sellers dominate, and bearish momentum prevails.
3. Sideways Market (Trading Range): Price moves horizontally between support and resistance with no clear direction. This consolidation phase often precedes major moves.
Here's what many traders miss: sideways markets aren't always perfect rectangles. I've seen markets printing higher highs with equal lows, or lower highs with higher lows - these are still sideways markets, just in different forms like triangles or broadening patterns.
These two concepts form the backbone of SMC analysis:
A BOS occurs when price moves above a previous high (in an uptrend) or below a previous low (in a downtrend). This confirms trend continuation and shows the current momentum remains intact.
I mark BOS at the exact point where price breaks the previous swing high or low - this precision matters for timing entries.
A CHOCH signals a potential trend reversal. It happens when price breaks structure in the opposite direction of the prevailing trend. For example, if an uptrend breaks below a recent swing low, it may indicate the beginning of a bearish phase.
Remember: a CHOCH doesn't guarantee an immediate reversal - it could signal a shift from trending to sideways action first.
Professional traders use TradingView's precise tools to mark these critical levels instantly
Start Free Trial 30 days free + $15 bonusNot all market levels are created equal. I've found that distinguishing between strong and weak levels can dramatically improve your trading accuracy:
Strong Low: Followed by a move that breaks above the previous high (causes BOS)
Strong High: Followed by a move that breaks below the previous low
These levels show clear market strength and are more likely to act as future support/resistance.
Weak Low: Fails to break any previous high after bouncing
Weak High: Fails to break any previous low after pulling back
Weak levels indicate insufficient buying or selling pressure and are less reliable for future trades.
Fair Value Gaps are price zones where the market moved so quickly that trading activity was thin or inefficient. I look for FVGs by examining three consecutive candles:
Find a strong momentum candle (at least 2-3x larger than previous candles)
Look for minimal overlap between candles 1 and 3
The gap between candle 1's high and candle 3's low (for bullish FVG) forms the zone
These gaps often act as magnets - price frequently returns to "fill" them, providing excellent entry opportunities. I've noticed FVGs work best when combined with other confluences like order blocks or liquidity zones.
How easily an asset can be bought or sold without moving the price
Smart Money Secret: Institutions target stop-loss clusters to create the liquidity they need for large orders!
Find support/resistance with 3+ touches
Watch for price to spike beyond the level
Buy/sell on candle close back inside zone
Place beyond the wick extreme
Minimum 2:1 risk-reward ratio
Professional crypto traders use Bybit's deep liquidity and advanced tools to execute these strategies
Start Trading Now Get up to $30,000 in bonusesLiquidity is simply how easily an asset can be bought or sold without significantly affecting its price. For SMC traders, understanding liquidity is crucial because:
High liquidity markets = Tighter spreads, less slippage, more stability
Low liquidity markets = Wider spreads, more manipulation potential
Smart money needs liquidity to execute large orders. They often target areas with concentrated stop-losses to create the liquidity they need.
Liquidity Grab: A quick, targeted move that briefly breaks a key level (usually just a wick) before snapping back. I typically see these as single-candle events with long wicks.
Liquidity Sweep: A broader push through a liquidity zone lasting multiple candles before reversing. These tend to trap more traders and create stronger reversal opportunities.
Identify clear support/resistance with multiple touches
Wait for a wick above resistance or below support
Enter on the candle close below/above the liquidity zone
Place stop-loss beyond the wick extreme
Target 2:1 risk-reward minimum
Markets operate 24/7 (crypto) or during specific hours (stocks/forex), but activity levels vary dramatically. I've found that understanding trading sessions can significantly improve your timing:
Asian (Tokyo): 00:00-09:00 - Calmer, range-bound, good for planning
London: 07:00-16:00 - High liquidity, strong trends, watch for fakeouts
New York: 13:00-22:00 - Most volatile, peak activity during London overlap
Sydney: 21:00-06:00 - Lower volume, potential for unexpected moves
The London-New York overlap (13:00-16:00 UTC) offers the highest volatility and best trend-following opportunities. I've noticed Bitcoin often makes significant moves during New York open.
Momentum trading aligns perfectly with Smart Money Concepts. Instead of trying to catch tops and bottoms, I trade in the direction of strength - buying high to sell higher.
Body at least 2x larger than recent candles (preferably 3-4x)
Accompanied by volume spike
Often breaks key structure or pattern
Spot momentum candle breaking structure
Confirm with increased volume
Enter on close or wait for pullback to order block
Stop below the impulse origin
Target 2:1 minimum risk-reward
Specific price zones where institutions placed massive orders - these footprints often become powerful future support/resistance levels
Look for sideways price action where market pauses
Strong directional candle breaks from consolidation
Confirm institutional activity with increased volume
Last 3-5 consolidation candle bodies form the OB
Pro Tip: Focus on candle bodies, not wicks, for cleaner order block levels!
Price must come back to test the order block zone
Pin bars & engulfing patterns signal entry
Place stops beyond the order block boundary
Aim for previous support/resistance levels
Professional traders use InvestingPro's advanced tools and AI insights to enhance their analysis
Try InvestingPro Save 55% today - Professional trading toolsOrder blocks are specific areas where institutions placed significant orders. These zones often become future support/resistance levels.
Look for consolidation followed by strong impulse move
The last candles of consolidation form the order block
Volume should spike during the impulse
Mark the zone from consolidation bodies
I typically include 3-5 candles in my order block zones, focusing on the candle bodies rather than wicks for cleaner levels.
Wait for price to return to the zone
Look for rejection patterns (pin bars, engulfing)
Enter with stops below/above the order block
Target previous structure levels
While traditional SMC focuses on price action, I've found order book analysis provides valuable additional context:
Bid/Ask Spread: Difference between buy and sell orders
Market Depth: Volume at each price level
Buy/Sell Walls: Large order clusters acting as support/resistance
Tools like Trading View's Volume Footprint and CVD (Cumulative Volume Delta) help visualize order flow, showing where smart money is actually transacting.
Even perfect SMC setups fail sometimes. I've learned that protecting capital is more important than any single trade:
Never risk more than 1-2% per trade
Always use stop-losses (no exceptions)
Minimum 2:1 risk-reward ratio
Calculate position size before entering
Combine your win rate with risk-reward to ensure long-term profitability. A 40% win rate with 3:1 risk-reward can be more profitable than 60% wins at 1:1.
I've discovered that trading psychology determines success as much as strategy. Even the best SMC setup fails if you can't execute it properly.
Accept that anything can happen - Even 90% probability setups can lose
Think in probabilities, not certainties - Focus on your edge over many trades
Detach from individual outcomes - One trade doesn't define your success
Follow your rules without exception - Consistency creates profitability
Follow this systematic process for every trade setup
After years of refinement, here's my systematic approach:
Identify market structure - Trending or ranging?
Mark key levels - Order blocks, FVGs, liquidity zones
Wait for confluence - Multiple factors aligning
Confirm with price action - Rejection patterns at key levels
Execute with proper risk - Predetermined stops and targets
Manage emotions - Stick to the plan regardless of feelings
Once you master the basics, consider these advanced concepts:
Nested order blocks within larger timeframe zones
Mitigation blocks for failed order block setups
Breaker blocks combining structure breaks with order flow
Optimal trade entry (OTE) using Fibonacci retracements
I've made all these mistakes, so you don't have to:
Overcomplicating analysis - More lines don't mean better trades
Ignoring market context - Trading against the higher timeframe trend
Forcing trades - Not every setup is worth taking
Moving stop-losses - Accept the predetermined risk
Revenge trading - Emotional decisions destroy accounts
While traditional technical analysis focuses on indicators and chart patterns, Smart Money Concepts specifically track institutional behavior through market structure, liquidity zones, and order flow. SMC provides a framework for understanding WHY price moves rather than just identifying patterns.
Profitability timelines vary greatly depending on dedication, practice, and risk management. I recommend at least 3-6 months of demo trading to master pattern recognition, followed by small live trading. Focus on consistency over quick profits - most successful SMC traders take 1-2 years to develop consistent profitability.
Yes, SMC principles work across all timeframes from 1-minute to monthly charts. However, higher timeframes (4H, Daily, Weekly) tend to provide more reliable signals with less noise. I recommend starting with higher timeframes and working down as you gain experience.
You can start learning SMC with zero capital using demo accounts. For live trading, the amount depends on your broker and risk tolerance. With proper position sizing and 1-2% risk per trade, you can start with as little as $100-500, though $1,000+ provides more flexibility.
The strongest order blocks typically have: 1) A sharp impulse move away from the zone, 2) High volume during formation, 3) Multiple touches that respect the level, 4) Confluence with other SMC concepts like FVGs or liquidity zones. Fresh, untested order blocks tend to be more reliable than heavily tested ones.
While SMC primarily relies on price action, indicators can provide additional confirmation. Volume indicators, RSI divergences, and moving averages can complement SMC analysis. However, avoid indicator overload - SMC concepts should be your primary decision-making tool, with indicators serving as secondary confirmation.
Smart Money Concepts provide a powerful framework for understanding market movements, but knowledge without action is worthless. Start with one concept - perhaps order blocks or liquidity grabs - and master it before adding more tools.
Practice on demo first, focusing on pattern recognition rather than profits. Once you can consistently identify setups, add small real money to test your psychology. Scale up only when you prove consistent profitability over at least 100 trades.
Remember: Smart money wins because they have an edge, proper risk management, and emotional control. Develop all three, and you can trade alongside the institutions rather than being their liquidity.
The markets will always be there tomorrow. Take time to study, practice, and develop your skills properly. Your future profitable self will thank you for the patience and discipline you show today.
Disclaimer: This content is for educational purposes only and should not be considered financial advice. Trading involves substantial risk of loss. Always conduct your own research and consider your financial situation before making any investment decisions.
Master the core concepts of BoS and CHoCH to identify key turning points in the market.
Deep dive into the essential market structure concepts that form the foundation of smart money trading.
Learn how to classify price levels to find the highest probability trading opportunities.
Discover how institutional traders hunt for liquidity and how you can profit from these movements.
Trading & Investing Enthusiast
Teaching traders to understand market psychology, technical analysis, and investing through clear beginner-friendly insights.
Started investing at 16 and became fascinated by how market psychology influences price movements. Still learning something new every day.
Love sharing what I've learned along the way. There's nothing quite like helping someone understand a concept that once confused me too.
Proud to have built a community where traders actively share insights and grow together through daily market analysis and discussion.
Want to join our learning journey?
Chart order blocks, FVGs, liquidity zones & execute like smart money
TradingView
Mark order blocks, FVGs, BOS/CHOCH & liquidity zones on any chart
30 Days Free + $15Bybit
Execute your SMC setups with proper 1-2% risk & 2:1 reward ratios
Up to $30K BonusInvestingPro
Track institutional order flow & smart money positioning in real-time
Save 70% Today