
What is Liquidity in Trading? A Complete Guide to Liquidity Grabs & Sweeps
Master liquidity concepts to understand why trading sessions create different market conditions and opportunities.
Last Updated: December 9, 2025
Prefer watching over reading? This YouTube video covers everything in this article - from understanding the 4 major trading sessions to identifying the best times to trade. You'll learn the same concepts about session overlaps, volatility patterns, and how to use the TradingView sessions indicator, all explained visually with chart examples.
Trading sessions follow major financial hubs (London, New York, Tokyo, Sydney) and each has distinct characteristics that can impact your trading success.
Session overlaps, especially London-New York (13:00-16:00 UTC), create the highest volatility and best trading opportunities due to increased liquidity.
The Asian session offers calmer, range-bound conditions ideal for technical analysis, while New York brings maximum volatility perfect for breakout strategies.
Risk management should adapt to session characteristics - use wider stops during volatile sessions and tighter stops during calmer periods.
The TradingView sessions indicator provides visual confirmation of session times and helps identify patterns in how instruments behave during different trading periods.
Have you ever wondered why Bitcoin sometimes explodes with massive price movements at specific times of the day? Or why your perfectly planned trades seem to fizzle out during certain hours? The answer lies in understanding trading sessions – one of the most overlooked yet powerful concepts in trading.
Recently, I've been tracking an fascinating pattern: Bitcoin has been experiencing significant price increases every time it enters the New York trading session. This isn't just coincidence – it's the power of trading sessions at work. In this comprehensive guide, you'll discover what trading sessions are, how they function, and most importantly, how to leverage them to potentially improve your trading results.
Whether you're trading crypto, forex, or stocks, understanding trading sessions can be the difference between catching major market moves and watching from the sidelines. By the end of this guide, you'll know exactly when the markets are most active, which sessions offer the best opportunities for your trading style, and how to use the powerful TradingView trading sessions indicator to visualize these crucial time periods on your charts.

What are Trading Sessions?
Trading sessions represent specific time periods when major financial markets around the world are actively trading. While cryptocurrency markets operate 24/7 and forex markets run 24 hours during weekdays, trading activity isn't uniform throughout the day. Think of it like rush hour traffic – there are peak times when everyone's on the move, and quieter periods when activity slows down.
The concept of trading sessions follows the major financial hubs across the globe. As the Earth rotates, different financial centers "wake up" and begin their trading day, creating waves of activity that ripple through the markets. These sessions are centered around cities like London, New York, Tokyo, and Sydney – each bringing its own unique market dynamics and opportunities.
What makes trading sessions particularly interesting is that each session typically develops its own personality. Some sessions tend to be calmer and more range-bound, making them ideal for certain trading strategies. Others are known for their volatility and trending behavior, creating opportunities for different approaches. Understanding these characteristics can help you align your trading strategy with the times when it's most likely to succeed.
For stock traders, this concept is even more straightforward – stock markets have defined opening and closing times. But for forex and crypto traders operating in 24-hour markets, knowing when major players are active becomes crucial for timing entries and exits effectively.
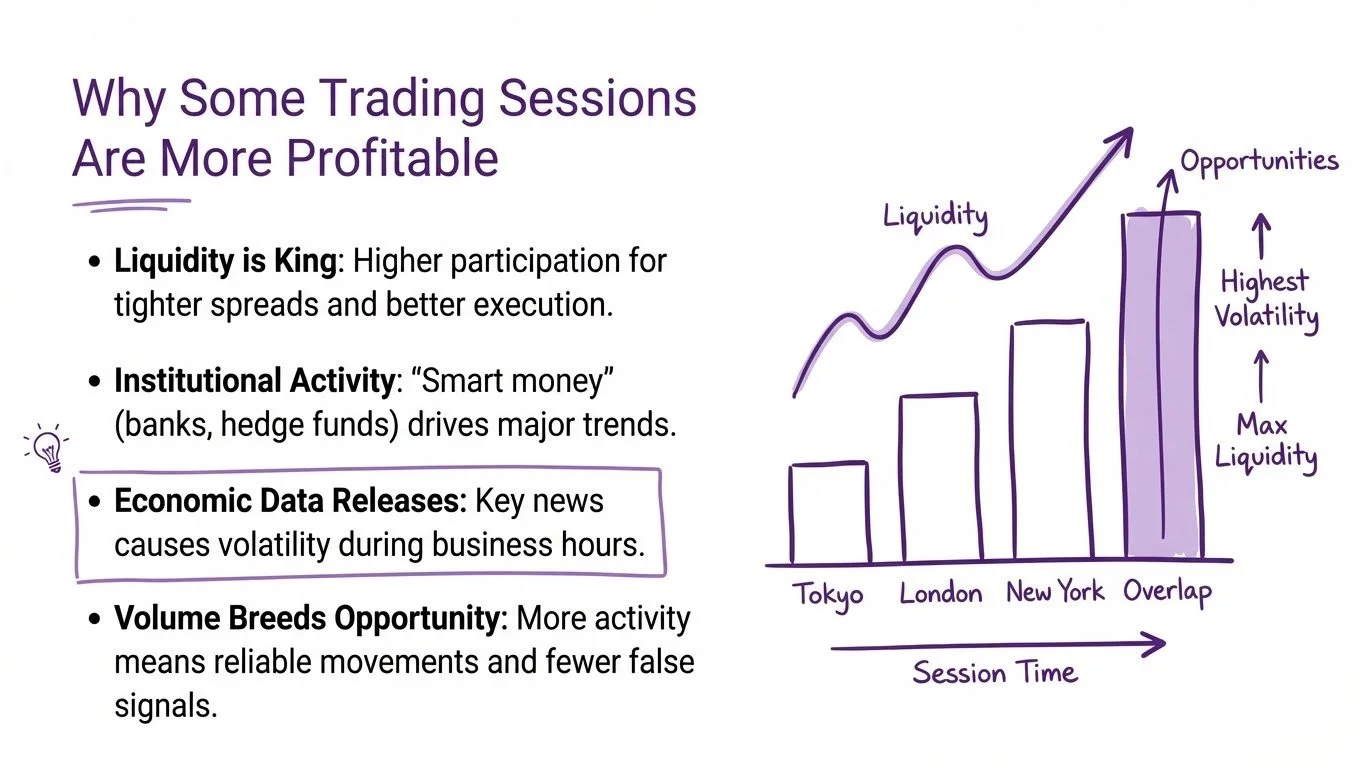
Why Some Trading Sessions Are More Profitable
Not all trading hours are created equal. The difference in profitability between trading sessions comes down to several key factors that every trader should understand.
Liquidity is King: During major trading sessions, more participants are active in the market. This increased participation means higher liquidity – the ability to buy or sell without significantly impacting the price. Higher liquidity typically leads to tighter spreads, better execution prices, and more reliable technical patterns.
Institutional Activity: Large banks, hedge funds, and institutional traders operate during their local business hours. When these "smart money" players are active, they bring significant capital and sophisticated trading strategies to the market. This institutional activity often creates the trends and movements that retail traders can ride for profits.
Economic Data Releases: Most important economic announcements happen during regular business hours in their respective regions. These data releases can create explosive volatility and trending moves that savvy traders can capitalize on. For instance, U.S. economic data typically releases during the New York session, often causing significant market movements.
Volume Breeds Opportunity: Higher trading volume during peak sessions means more opportunities for your trades to work out as planned. Low-volume periods can see erratic price action and false breakouts that can trap unsuspecting traders.
Understanding the timing and characteristics of each major trading session is fundamental to successful trading. Let me break down each session using UTC time (Coordinated Universal Time) to maintain consistency regardless of where you're trading from.
The calmest session with range-bound conditions. Perfect for technical analysis and planning trades. Major centers: Tokyo, Hong Kong, Singapore.
High liquidity powerhouse that sets daily trends. Europe's financial capital brings massive trading volumes and strong directional moves.
The heavyweight champion with highest volatility. Home to Wall Street, this session sees explosive moves especially during economic data releases.
The bridge between NY close and Asian open. Generally quieter but important for positioning ahead of the Asian session.
Pro Tip: The London-New York overlap (13:00-16:00 UTC) creates the most explosive trading opportunities with peak volatility and liquidity!
Want to visualize these sessions automatically on your charts?
Get TradingView Premium & Access the Trading Sessions Indicator✓ 30-Day Free Trial ✓ $15 Bonus ✓ Auto Session Indicator Included
The Asian session kicks off the global trading day. Centered around Tokyo, this session includes activity from major financial centers like Hong Kong, Singapore, and Sydney. While often considered the calmest session, don't let that fool you – significant moves can and do happen during Asian hours.
The London session is where things start to heat up. As the financial capital of Europe, London sees massive trading volumes and often sets the tone for the day. This session is known for establishing strong trends that can continue throughout the day.
The New York session is the heavyweight champion of trading sessions. Home to Wall Street and the world's largest financial markets, this session often sees the highest volatility and most significant price movements. When major U.S. economic data releases during this time, markets can move dramatically.
The Sydney session bridges the gap between the New York close and the Asian open. While generally quieter than other major sessions, it plays an important role in setting up trades for the upcoming Asian session.
See exactly when sessions overlap and where the highest volatility opportunities occur
13:00 - 16:00 UTC
3 Hours
The "Golden Hours" — Peak liquidity, strongest trends, best opportunities. This is when the magic happens!
07:00 - 09:00 UTC
2 Hours
Asian close meets European open. Good for EUR/JPY, GBP/JPY pairs and breakout setups.
00:00 - 06:00 UTC
6 Hours
Calmer conditions. Good for AUD/JPY, NZD/JPY. Range trading strategies work well here.
Pro Tip: Set alerts 15 minutes before the London-New York overlap (12:45 UTC) to prepare for the highest volatility period of the day.
Here's where things get really interesting. When two major sessions overlap, magic happens in the markets. These overlap periods combine the liquidity and activity of multiple financial centers, creating some of the best trading opportunities of the day.
This two-hour window sees Asian traders wrapping up their day while European traders are just getting started. While not as volatile as other overlaps, this period can see interesting moves in Asian and European currency pairs.
This is the golden hour of forex and crypto trading. When London and New York are both in full swing, the markets come alive. I've personally witnessed Bitcoin making massive moves during this overlap period. Just recently, we saw significant price increases during multiple London-New York overlap sessions. This three-hour window often accounts for the majority of daily trading range in many instruments.
While generally calmer, this extended overlap period is important for traders focusing on AUD, NZD, and JPY pairs. It's also when Asian markets digest news from the U.S. session and position for the upcoming day.
The Asian session offers unique opportunities for traders who understand its characteristics. Generally speaking, this session tends to be more range-bound and predictable, making it excellent for certain strategies.
Range Trading Paradise: The lower volatility during Asian hours often creates clear support and resistance levels. Traders can look for price to bounce between these levels, buying at support and selling at resistance. This approach works particularly well with major forex pairs during this session.
The Setup for London: Many professional traders use the Asian session to identify key levels and potential breakout points for the upcoming London session. The Asian range often acts as a springboard for European breakouts.
News Trading Opportunities: Asian economic data, particularly from Japan and China, can create significant moves. Traders focusing on JPY, AUD, and NZD pairs should pay attention to data releases during this session.
Cryptocurrency Considerations: Interestingly, crypto markets can behave somewhat unpredictably during Asian hours due to lower overall liquidity. This can create both opportunities and risks – smaller orders can move the market more significantly, leading to potential stop-loss hunting or unexpected breakouts.
The London session is where many professional traders make their money. As someone trading from a timezone close to London, I've observed firsthand how this session can offer exceptional trading opportunities.
Trend Establishment: London often sets the trend for the day. The first hour can be particularly volatile as traders position themselves based on overnight developments and early European data.
Breakout Bonanza: The increase in liquidity as London opens often triggers breakouts from the Asian session ranges. However, be cautious during the first hour – fake breakouts are common as the market finds its direction.
Currency Pairs to Focus On: EUR, GBP, and CHF pairs see their highest activity during London hours. These pairs often offer the tightest spreads and most reliable technical patterns during this session.
The London Open Strategy: One popular approach is to wait for the first hour of London to establish a range, then trade the breakout of that range. This strategy capitalizes on the tendency for strong moves to continue once London finds its direction.
The New York session is where the big moves happen. As the video transcript mentioned, Bitcoin has been showing massive price increases during New York sessions recently, and this isn't unusual – this session is known for its volatility.
Maximum Volatility: When New York opens while London is still active (13:00 to 16:00 UTC), we see peak market activity. This overlap period often produces the largest price movements of the day.
News Impact: U.S. economic data releases during this session can create explosive moves. Recently, news about U.S.-China trade relations, Federal Reserve decisions, and inflation data have caused significant market volatility during New York hours.
Stock Market Correlation: The New York session sees the highest correlation between different asset classes. When U.S. stocks make big moves, it often impacts forex and crypto markets simultaneously.
End of Session Dynamics: After London closes at 16:00 UTC, volatility typically decreases, but important moves can still occur, especially if there's significant U.S. news or events.
Open TradingView chart
Click "Indicators" tab
Search "sessions"
Select official indicator
Colored vertical bands instantly show when each trading session is active
Easily spot how your instruments behave during different sessions
Clearly see high-volatility overlap periods for maximum opportunities
Adjust colors, sessions, and daylight saving settings to your preference
🎁 Special Offer for Mind Math Money Readers!
Start Your 30-Day FREE TrialPlus get $15 bonus when you upgrade!
Now, let me share one of my favorite tools for tracking trading sessions – the TradingView trading sessions indicator. This powerful visualization tool has been instrumental in identifying the patterns I mentioned at the beginning of this article.
How to Access the Indicator:
Open TradingView and navigate to your chart
Click on the "Indicators" tab at the top of the screen
Search for "sessions" or "trading sessions"
Select the official "Sessions" indicator
What You'll See: The indicator displays colored vertical bands on your chart representing each major trading session. You can instantly see when sessions begin, end, and overlap. This visual representation makes it easy to identify patterns in how your chosen instrument behaves during different sessions.
Customization Options: You can customize which sessions to display, their colors, and even adjust for daylight saving time changes. This flexibility allows you to focus on the sessions most relevant to your trading strategy.
Availability Note: While this indicator should be available on TradingView's free plan, some features might require a premium subscription. If you're serious about using session analysis in your trading, the premium features are worth considering for the additional customization options and multiple indicator capability.
Understanding basic session times is just the beginning. Professional traders use several advanced concepts to maximize their edge during different trading sessions.
Session Momentum: Each session tends to have its own momentum patterns. For example, trends established during the London session often continue into the early New York session. Recognizing these momentum patterns can help you stay on the right side of the market.
Inter-session Gaps: The gaps between major sessions can create interesting trading opportunities. Price often retraces during quiet periods, only to resume the trend when the next major session opens.
Session-Based Support and Resistance: Key levels established during one session often act as important support or resistance during subsequent sessions. The high and low of the Asian session, for instance, frequently become important levels during London trading.
Volume Profile Analysis: Combining session analysis with volume profile can reveal where major players are positioning themselves. High volume nodes during specific sessions often become magnets for price in future sessions.
Your risk management approach should adapt to the session you're trading. Here's how to protect your capital while maximizing opportunities:
Position Sizing by Session: Consider using smaller position sizes during low-liquidity sessions and scaling up during high-activity periods. This approach helps maintain consistent risk while adapting to market conditions.
Stop Loss Considerations: Wider stops might be necessary during volatile sessions like the London-New York overlap, while tighter stops can work during the calmer Asian session. Always base your position size on your stop loss distance to maintain consistent risk.
Time-Based Exits: Some traders use session boundaries as exit signals. For example, closing positions before the London session ends can help avoid the drop in liquidity that often follows.
News Awareness: Each session has its own economic calendar. Being aware of upcoming news releases during your trading session is crucial for risk management. Major news can cause significant slippage and gap moves.
UTC (Coordinated Universal Time) is the best time zone to use for consistency. It doesn't change with daylight saving time and provides a universal reference point. You can easily convert UTC to your local time using online converters or by checking "UTC time now" on Google.
Yes, you can trade during off-peak hours, but be aware of lower liquidity and potentially wider spreads. Some strategies, like range trading, may actually work better during quieter sessions. However, major price movements and trends typically occur during peak session times.
The Asian session is often recommended for beginners due to its generally calmer, more predictable nature. The lower volatility allows new traders to practice their strategies without the extreme price swings common during London or New York sessions. However, the best session ultimately depends on your available time and preferred trading style.
While crypto markets trade 24/7, they still show patterns aligned with traditional trading sessions. Bitcoin and other major cryptocurrencies often see increased volatility during the New York session and session overlaps. The Asian session can see unexpected moves due to lower overall liquidity in the crypto markets.
The basic sessions indicator should be available on TradingView's free plan. However, premium features offer more customization options, the ability to use multiple indicators simultaneously, and other advanced features that can enhance your session-based trading analysis.
Economic data typically releases during the business hours of the country reporting it. U.S. data releases during New York session, European data during London session, and so on. These releases can cause significant volatility, making it crucial to check the economic calendar for your trading session.
Trading sessions are more than just time zones – they're the rhythm of the global financial markets. By understanding when different financial centers are active, how sessions overlap, and the unique characteristics of each trading period, you can dramatically improve your trading results.
Remember, the best trading session for you depends on multiple factors: your strategy, the instruments you trade, your available trading time, and your risk tolerance. Some traders thrive in the volatility of the London-New York overlap, while others prefer the calmer waters of the Asian session.
The key is to observe how your chosen markets behave during different sessions and align your trading approach accordingly. Use tools like the TradingView sessions indicator to visualize these patterns, but always remember that successful trading requires more than just knowing when to trade – it requires discipline, proper risk management, and continuous learning.
Start by paper trading during different sessions to get a feel for their characteristics. Track your results and see which sessions align best with your trading style. With time and practice, you'll develop an intuitive understanding of market rhythms that can give you a significant edge in your trading journey.
Ready to master trading sessions? Start by adding the TradingView sessions indicator to your charts today and begin observing how your favorite instruments behave during different trading sessions. Remember, knowledge is power, but applied knowledge is profit.
Disclaimer: This content is for educational purposes only and should not be considered financial advice. Trading involves significant risk, and you should always conduct your own research and consider consulting with a qualified financial advisor before making any trading decisions.
Master liquidity concepts to understand why trading sessions create different market conditions and opportunities.
Learn how to analyze markets across multiple timeframes and sessions for better trading decisions.
Discover how volume patterns change across trading sessions and what they reveal about market movements.
Understand how institutional traders operate during different sessions and how to follow their footprints.
Trading & Investing Enthusiast
Teaching traders to understand market psychology, technical analysis, and investing through clear beginner-friendly insights.
Started investing at 16 and became fascinated by how market psychology influences price movements. Still learning something new every day.
Love sharing what I've learned along the way. There's nothing quite like helping someone understand a concept that once confused me too.
Proud to have built a community where traders actively share insights and grow together through daily market analysis and discussion.
Want to join our learning journey?