
Break of Structure (BoS) and Change of Character (CHoCH) Trading Strategy
Master the core concepts of BoS and CHoCH to identify key turning points in the market and enhance your supply and demand trading.
If you prefer learning by watching, you are in the right place. In this YouTube video, you will learn everything you need to know about supply and demand trading, from understanding the fundamental forces behind price movements to identifying high-probability zones and executing profitable trades with proper risk management.
Supply and demand are the fundamental forces behind all price movements—demand (buying pressure) pushes prices up, while supply (selling pressure) pushes prices down.
Price movements result from imbalances between supply and demand, with shifts in these forces creating the explosive moves that form tradable zones.
The four main zone types are aggressive demand zones, aggressive supply zones, strong high/low zones, and fresh versus tested zones—each offering different trading opportunities.
Supply and demand zones are institutional footprints marking areas where smart money has previously entered or exited, often containing unfilled orders that can trigger future reactions.
Combining multiple confluence factors (demand zones, chart patterns, indicators, and volume) can significantly increase your probability of success in supply and demand trading.
Understanding supply and demand is like discovering the DNA of every price movement in financial markets. Whether you're trading stocks, forex, crypto, or any other asset, mastering these fundamental forces can transform your trading approach and help you identify high-probability opportunities that others miss.
In this comprehensive guide, I'll walk you through everything you need to know about supply and demand trading—from the foundational concepts to advanced strategies you can apply immediately. By the end, you'll understand not just what supply and demand zones are, but why they work and how to trade them effectively.
Supply and Demand Trading Explained
Supply and demand represent the core forces behind every single price movement you see on a chart. When you watch prices rise, that's supply and demand at work. When prices fall, that's also supply and demand.
In simple terms:
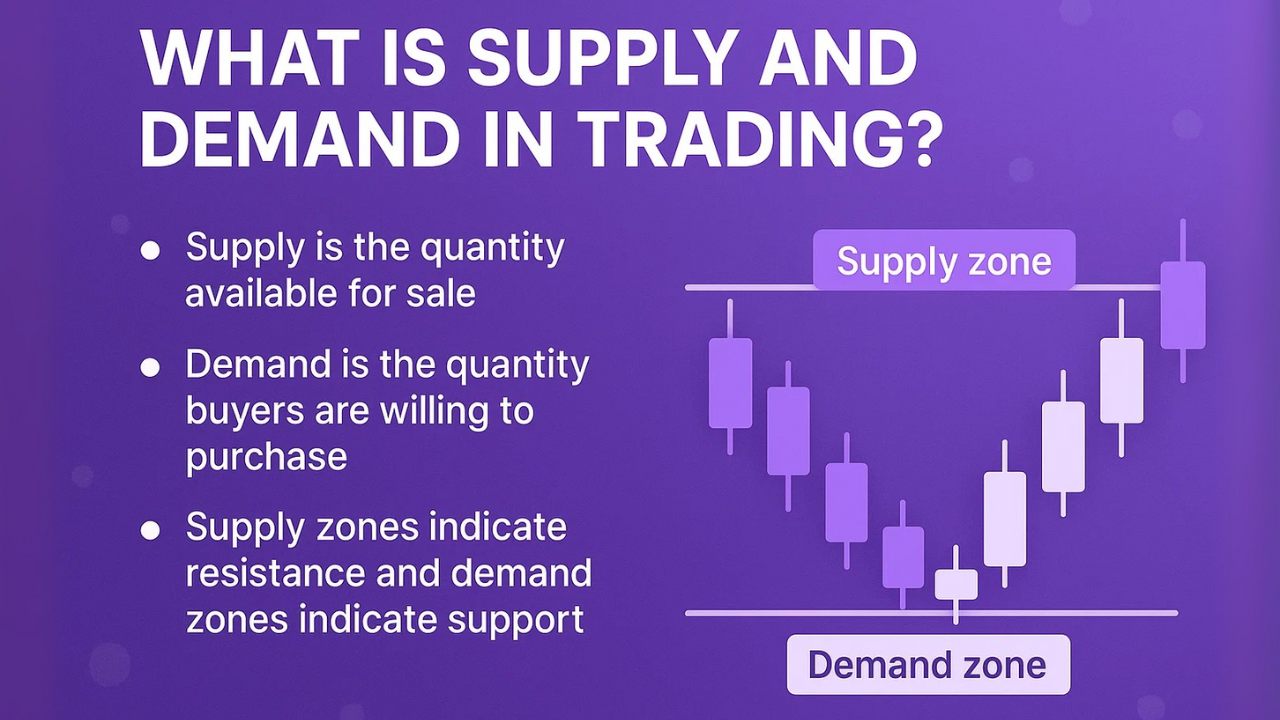
Demand is buying pressure—the force that pushes prices up. When traders say they're seeing "lots of demand at this zone," they mean strong buying pressure is appearing at that price level.
Supply is selling pressure—the force that pushes prices down. When you hear "supply is coming into the market," it means selling pressure is increasing.
The key insight here is that price movements come from imbalances between supply and demand. When demand exceeds supply, prices rise. When supply exceeds demand, prices fall. Every candlestick chart you've ever seen is essentially a visual story of these imbalances playing out in real-time.
To truly understand supply and demand trading, you need to grasp the fundamental laws that govern price behavior. I can break this down into two simple principles:
The law of demand states that the higher the price, the lower the demand will be. This might sound abstract, so let me illustrate with a practical example.
Imagine a chocolate bar priced at $10 versus one priced at $1. Which would attract more buyers? Obviously the $1 chocolate bar. As prices decrease, more people want to buy. At $1, you'll see massive demand because it's affordable. At $10, only a small number of buyers (perhaps those who don't care about price) will purchase.
This creates what we call a demand curve—as price decreases, quantity demanded increases. This same principle applies to Bitcoin, stocks, or any tradable asset.
The law of supply works in the opposite direction: the higher the price, the higher the supply.
Using the chocolate example again, if stores can sell chocolate bars for $10 each, many sellers will want to participate because profit margins are huge. If they can only sell for $1, far fewer sellers will be willing to supply chocolate at such thin margins.
This creates a supply curve—as price increases, quantity supplied increases.
When you plot both curves together, they intersect at what's called the equilibrium point. This is where supply equals demand, and it represents the natural price level the market seeks.
Let's say Bitcoin is trading at $150,000. If at this price we have more sellers than buyers (more supply than demand), the price will be pushed down until it reaches equilibrium. Conversely, if Bitcoin is at $50,000 and we have more buyers than sellers (more demand than supply), the price will be pushed up until equilibrium is reached.
This constant dance between supply and demand, always seeking equilibrium, is what creates every price movement you see.
Here's where it gets really powerful for traders. The concepts of demand shifts and supply shifts are absolutely essential if you want to trade supply and demand zones successfully.
More buyers at each price level
Shifts RIGHT →
Prices RISE ↑
• Positive news breaks
• Institutions accumulate
• Bullish sentiment surge
More sellers at each price level
Shifts RIGHT →
Prices FALL ↓
• Institutions distribute
• Negative catalysts hit
• Bearish sentiment grows
Get AI-powered analysis and institutional trading signals with InvestingPro
A demand shift occurs when demand for an asset changes at a specific price level.
Imagine a scientific study suddenly announces that chocolate has incredible health benefits. What happens? At every price point, demand increases dramatically. People who never bought chocolate might start buying it daily. The entire demand curve shifts to the right, meaning more buyers at each price level.
This shift creates a new equilibrium point at a higher price. This is exactly what happens in trading when positive news breaks, when institutions start accumulating, or when market sentiment shifts bullish. The demand shift pushes prices higher.
The opposite can also occur. If negative news emerges (like a study showing chocolate is toxic), the demand curve shifts left. Fewer buyers want chocolate at any given price, creating a new equilibrium at a lower price.
For traders, the key takeaway is: Positive demand shifts push prices up.
A supply shift happens when the quantity sellers are willing to supply changes at a given price level.
Continuing the chocolate example, imagine new technology makes chocolate production faster and cheaper. At $5 per bar, far more producers are now willing to supply chocolate than before. The supply curve shifts right.
This creates a new equilibrium at a lower price. In real markets, this happens when institutions sell heavily, when negative catalysts emerge, or when market sentiment turns bearish.
For traders, the key takeaway is: Positive supply shifts (more supply) push prices down.
Understanding these shifts helps you recognize when major market moves are likely to occur and why certain price levels become significant.
Now we get to the practical application—supply and demand zones are specific areas on your chart where you've identified strong imbalances between buyers and sellers.
A demand zone is an area where you have more buyers than sellers, leading to significant upward price movements. These zones often appear as consolidation areas before explosive moves higher.
A supply zone is an area where you have more sellers than buyers, resulting in major price drops. These appear as consolidation before sharp declines.
Supply and demand zones are essentially institutional footprints. They mark areas where smart money (banks, hedge funds, large traders) has previously entered or exited positions.
These zones can trigger reactions for several reasons:
Unfilled orders: Large institutions often can't fill all their orders at once. When an institution accumulates Bitcoin and pushes price higher, they may still have buy orders waiting at lower levels. When price returns, those orders can trigger fresh buying pressure.
Institutional memory: If a major player was willing to buy heavily at a specific level once, there's strong probability they'll do it again under similar conditions.
Self-fulfilling prophecy: As more traders recognize these patterns and place trades at these zones, they become even more reliable. The collective attention creates additional pressure at these levels.
Not all zones are created equal. Understanding the different types helps you identify the highest-probability setups.
Sharp, explosive price movements with momentum
Critical swing points causing structure breaks
Untested zones with intact imbalances
Previously touched, diminished strength
Use TradingView's professional charting tools to spot supply & demand zones in real-time
Aggressive demand zones are characterized by sharp, explosive movements to the upside. I look for three specific signals when identifying these:
Momentum candles: A candle at least twice the size of previous candles, showing powerful buying pressure.
Bullish engulfing patterns: A candle that completely engulfs the prior red candle (or multiple candles), opening below and closing above the previous candle's range.
Strong follow-through: The explosive move continues with additional strong candles, confirming the demand shift.
When all three signals align, you've identified a high-probability aggressive demand zone that can provide excellent entry opportunities on retest.
These are the mirror opposite of aggressive demand zones. I look for:
Bearish momentum candles: Large red candles significantly bigger than preceding candles.
Bearish engulfing patterns: Red candles that completely engulf previous green candles.
Strong downward follow-through: Confirming the supply shift with continued selling pressure.
These zones often mark major reversal points or continuation patterns in downtrends.
These zones appear at critical swing points in the market and require understanding market structure.
A strong low creates a break of structure to the upside in an uptrend. A strong high creates a break of structure to the downside in a downtrend.
To qualify as a strong high/low demand zone, you need both the structural significance AND a powerful move away from that level. Not every strong high or low automatically becomes a tradable zone—you need confirmation through price action.
This distinction can significantly improve your trading results:
Fresh zones haven't been tested since they formed. These are generally considered stronger and more reliable because the supply/demand imbalance is still intact.
Tested zones have already been touched at least once. While they can still work, they're typically weaker than fresh zones because some of the pending orders may have been filled.
My preference is always to trade fresh zones when possible, but tested zones can still provide good opportunities if they show strong reactions on the initial test.
This is where many traders get confused, but it's actually straightforward once you understand the principles. I use two main methods:
Identify the final candle before the explosive move begins. Draw your rectangle from the high to low of that candle (including the wick), then extend it to the right.
This method is clean, simple, and easy to replicate consistently.
Instead of using just one candle, include the 2-3 candles before the move started. Make sure to include the extreme wick because it shows where the imbalance truly began.
This method provides a slightly wider zone, which some traders prefer for additional buffer.
Important: Don't obsess over finding the "perfect" way to draw zones. Real markets aren't perfect. Choose one method and stick with it consistently. This makes backtesting and tracking your performance much easier.
I also recommend adjusting zones if false breakouts or liquidity grabs occur. If price spikes above a supply zone and then sharply reverses (a liquidity grab), I'll adjust the zone to capture the origin of that reversal move.
Now let's explore how to actually profit from these concepts.
Buy at demand, sell at supply
Trade pullbacks to zones in trends
Buy at demand, sell at supply in ranges
Trade zone breakouts with retests
Higher TF zones + lower TF entries
| Strategy | Best For | Difficulty | Risk/Reward |
|---|---|---|---|
| Reversal | Beginners | ⭐⭐ | High |
| Trend Continuation | Trending markets | ⭐⭐ | High |
| Range Trading | Sideways markets | ⭐⭐⭐ | Medium |
| Breakout & Retest | Advanced traders | ⭐⭐⭐⭐ | Very High |
| Multi-Timeframe | All traders | ⭐⭐⭐ | Very High |
Trade crypto with advanced charting, low fees, and up to 100x leverage
This is the most common approach—buying at demand zones and selling at supply zones. The key is waiting for confirmation before entering. Don't just buy because price touches a demand zone; wait for bullish signals like momentum candles or reversal patterns.
In strong trends, use strong high/low zones to trade pullbacks. In uptrends, look for strong low demand zones to enter on retracements. In downtrends, use strong high supply zones to add to short positions.
This strategy keeps you aligned with the dominant trend while getting better entry prices.
Sometimes price gets stuck between a clear supply zone above and demand zone below. You can trade the range by buying near demand and selling near supply, taking quick profits as price oscillates.
Ranges can be less common but extremely profitable when you identify them correctly.
Advanced traders can use supply and demand zones for breakout trading. When price breaks through a significant zone, wait for a retest of that broken level before entering. The former supply becomes demand (or vice versa).
This is one of my favorite approaches. Identify zones on a higher timeframe (like the daily chart), then zoom into a lower timeframe (4-hour or 1-hour) to find precise entry points.
This combines the reliability of higher timeframe zones with the precision of lower timeframe entries, potentially improving your risk-reward ratio significantly.
Let me walk you through a real example combining everything we've covered.
Step 1: Identify the Zone
I'm looking at a daily chart showing an uptrend. I identify a strong low demand zone where we saw a break of structure. While the initial candles weren't perfect momentum candles, the structural significance (strong low in an uptrend) makes this a valid zone.
Step 2: Add Confluence
I zoom into the 4-hour timeframe and notice:
A falling wedge pattern (bullish chart pattern) forming at the demand zone
Bullish divergence on the RSI indicator (price making lower lows, RSI making higher lows)
Volume spike on the reversal candle (confirming strong demand)
Three bullish signals plus our demand zone = high-probability setup.
Step 3: Entry
I enter at the close of the strong momentum candle that breaks out of the falling wedge. This provides clear confirmation that demand is taking control.
Step 4: Stop Loss
I have two options:
Conservative: Below the lowest point of the red candle that preceded the reversal
Safer: Below the entire demand zone
Choose based on your risk tolerance and position sizing.
Step 5: Target
Option A: Use a fixed risk-reward ratio like 2:1 (target is twice the distance of your stop loss)
Option B: Use market structure to identify the next resistance level or supply zone
In this example, a 2:1 risk-reward would have captured quick profits. A structure-based target at the next resistance would have yielded even more.
While similar in concept, supply and demand zones focus on areas where strong imbalances occurred, marked by explosive price movements. Support and resistance are simply price levels where the market has reversed multiple times. Supply and demand zones identify the origin of institutional footprints, while support and resistance are more general concepts. Supply and demand trading can provide more precise entry and exit points.
Supply and demand zones can remain valid for extended periods, sometimes months or even years, especially on higher timeframes. However, their strength diminishes with each test. Fresh zones (untested) are typically stronger than tested zones. A zone becomes invalid when price breaks through it decisively with strong momentum and doesn't return. The key is to watch how price reacts when it revisits the zone.
Yes, supply and demand principles work on all timeframes—from 1-minute charts for scalping to monthly charts for long-term investing. However, higher timeframes (daily, weekly) generally provide more reliable zones because they represent larger institutional activity. Lower timeframes can be used for precision entries once you've identified zones on higher timeframes. The key is ensuring sufficient liquidity in whatever asset and timeframe you're trading.
Aggressive zones are identified purely by price action—momentum candles, engulfing patterns, and explosive moves. Strong high/low zones require market structure analysis and appear at swing points that cause breaks of structure. Aggressive zones focus on the strength of the move, while strong high/low zones focus on structural significance. Both can be powerful, and sometimes they overlap, creating even stronger setups.
While fresh zones are generally stronger and preferred, tested zones can still provide excellent trading opportunities. The key is watching how price reacted on the first test. If the zone held strongly with a powerful reversal, it may work again. However, if the test was weak or price lingered in the zone, it's likely lost strength. Fresh zones should be your priority, but don't automatically dismiss tested zones—analyze each situation individually.
Supply and demand works excellently with confluence from other methods. Combine zones with chart patterns (like wedges or triangles), indicators (RSI divergence, MACD), Fibonacci retracements, or volume analysis. Multi-timeframe analysis is particularly powerful—identify zones on higher timeframes, then use lower timeframes for precise entries. The more confluence factors that align, the higher your probability of success. Just avoid over-complicating your analysis.
Supply and demand trading isn't just another indicator-based strategy—it's understanding the fundamental forces that move every market. By identifying where major imbalances between buyers and sellers have occurred, you can position yourself alongside the smart money rather than against it.
Remember these key principles:
Demand (buying pressure) pushes prices up; supply (selling pressure) pushes them down
Demand and supply shifts create the explosive moves that form tradable zones
Not all zones are equal—look for aggressive zones, strong high/low zones, and fresh zones
Combine multiple confluence factors to increase your probability of success
Always use proper risk management with clear stop losses
The concepts in this guide can be applied to any market and any timeframe. Whether you're day trading crypto on 5-minute charts or swing trading stocks on daily charts, these principles remain constant.
Your next step? Start by studying your charts and identifying these zones. Practice drawing them consistently using one method. Then begin tracking how price reacts when it returns to these areas. Over time, you'll develop an intuitive feel for high-quality setups.
Supply and demand trading can provide you with a significant edge in the markets—but only if you put in the work to truly understand and apply these concepts.
Ready to take your trading to the next level? Make sure to check out my complete market structure course next, which builds perfectly on these supply and demand concepts.
Disclaimer: This content is for educational purposes only and should not be considered financial advice. Trading involves substantial risk of loss. Past performance does not guarantee future results. Supply and demand trading strategies can help improve your analysis, but no strategy guarantees profits. Always conduct your own research, understand the risks involved, and consider your financial situation before making any investment decisions. Never trade with money you cannot afford to lose.
Master the core concepts of BoS and CHoCH to identify key turning points in the market and enhance your supply and demand trading.
Learn how to classify price levels to find the highest probability supply and demand zones for your trading strategy.
Discover how institutional traders hunt for liquidity at supply and demand zones and how you can profit from these movements.
Explore how Fair Value Gaps provide precise entry opportunities when combined with supply and demand analysis.
Trading & Investing Enthusiast
Teaching traders to understand market psychology, technical analysis, and investing through clear beginner-friendly insights.
Started investing at 16 and became fascinated by how market psychology influences price movements. Still learning something new every day.
Love sharing what I've learned along the way. There's nothing quite like helping someone understand a concept that once confused me too.
Proud to have built a community where traders actively share insights and grow together through daily market analysis and discussion.
Want to join our learning journey?
Draw zones, identify fresh setups, and trade with institutional footprints