
Break of Structure (BoS) and Change of Character (CHoCH) Trading Strategy
Deep dive into the most important market structure concepts that can transform your trading accuracy and timing.
Learn better by video? Watch this comprehensive technical analysis course on YouTube covering candlestick patterns, market structure, price action, and essential indicators. From reading your first chart to executing advanced strategies with proper risk management – all explained with real trading examples in this step-by-step tutorial.
Technical analysis is about finding high-probability setups through studying price and volume, not predicting the future with 100% certainty
Markets exist in only three states: uptrend (higher highs and lows), downtrend (lower highs and lows), or range (sideways consolidation)
Break of Structure (BOS) confirms trend continuation while Change of Character (CHoCH) provides early warning signals for potential reversals
Price action reveals the market's current character while market structure shows historical movement - both are essential for complete analysis
Risk management is crucial: limit risk to 1-2% per trade and use risk-reward ratios of at least 2:1 to potentially maintain profitability even with lower win rates
If you want to master technical analysis and potentially transform your trading results, you're in the right place. After years of analyzing charts across stocks, crypto, forex, and commodities, I've discovered that most traders overcomplicate technical analysis. The truth is, mastering just a few core concepts can dramatically improve your trading decisions.
In this comprehensive guide, I'll share everything you need to know about technical analysis – from reading your first candlestick to executing advanced trading strategies. By the end, you'll understand not just the "what" but the crucial "why" behind every chart pattern, indicator, and price movement.
Whether you're a complete beginner or looking to refine your skills, this step-by-step approach will help you develop the analytical skills that can separate profitable traders from the rest.
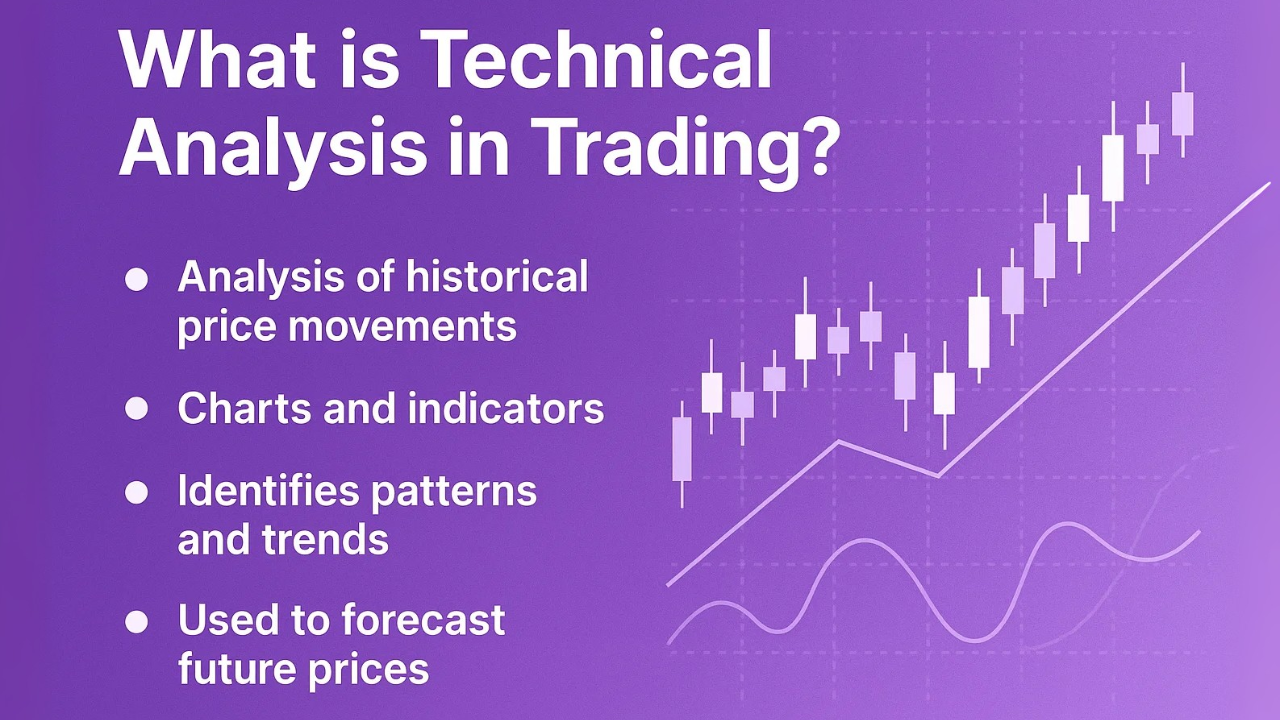
What is Technical Analysis in Trading?
Technical analysis is fundamentally the study of price and volume movements to forecast market direction. But here's what most people miss: charts aren't just random lines – they're the collective psychology of millions of traders displayed in real-time.
Think of it this way: every candlestick on your chart represents a battle between buyers (bulls) and sellers (bears). When I first understood this concept, it completely changed how I viewed the markets. Charts show the actual money flow – where smart money institutions, hedge funds, and retail traders are placing their bets.
The key insight? Technical analysis isn't about predicting the future with 100% certainty – it's about finding high-probability setups. If you can identify patterns that succeed even 60-70% of the time with proper risk management, you can potentially build consistent trading results.
From my experience, three main groups rely heavily on technical analysis:
Day traders who enter and exit positions within the same trading day
Swing traders holding positions from days to weeks
Long-term investors using technical analysis to optimize entry and exit points
The beauty is that these principles work across all markets – whether you're trading Tesla stock, Bitcoin, EUR/USD forex pairs, or gold futures.
Bullish Movement
Bearish Movement
A candle closing at $101 only shows the end result. The journey from $100→$98→$103→$101 reveals the real battle between buyers and sellers!
Ready to read candlesticks like a pro?
Try TradingView 30-day free premium + $15 bonusBefore you can analyze any market, you need to master candlestick reading. This is non-negotiable – it's like trying to read a book without knowing the alphabet.
Every candlestick tells a story through four critical data points:
Green (Bullish) Candles:
Open: Where the price started during the period
Close: Where the price ended (higher than the open)
High: The highest price reached
Low: The lowest price reached
Red (Bearish) Candles:
Same four data points, but the close is lower than the open
Here's something crucial that took me years to fully appreciate: the path the price took during a candle is just as important as where it ended.
For example, in a 15-minute candle, the price might have:
Opened at $100
Dropped to $98 (the low)
Surged to $103 (the high)
Closed at $101
This tells us there was initial selling pressure, followed by strong buying that overcame the sellers – valuable information you can't see from the closing price alone.
Market structure is what I consider the "big picture framework" of price movement. Once you understand this, you'll never look at charts the same way again.
Markets can only exist in one of three states at any given time:
1. Uptrend (Bullish Market Structure)
Creates higher highs (HH) and higher lows (HL)
Bulls are in control
Each pullback is typically a buying opportunity
2. Downtrend (Bearish Market Structure)
Creates lower highs (LH) and lower lows (LL)
Bears dominate
Rallies often present shorting opportunities
3. Range/Consolidation (Sideways Market)
Price oscillates between support and resistance
Neither bulls nor bears have clear control
Often precedes major breakouts
These two concepts transformed my trading accuracy:
Break of Structure (BOS): When price breaks above a previous high in an uptrend or below a previous low in a downtrend, confirming trend continuation. I've found that strong BOS moves with volume often lead to extended trends.
Change of Character (CHoCH): When price breaks below a low that caused a BOS in an uptrend (or above a high that caused a BOS in a downtrend). This is your early warning system for potential reversals.
In my experience, identifying CHoCH moments before they become obvious to most traders can give you a significant edge.
Market Structure = Where price has been (the map)
Price Action = How price moves NOW (the character)
Strong buyers present
✓ Consider LONGBuyers lack confidence
⚠ WAIT or prepare SHORTBears in control
✓ Consider SHORTWhen BTC approached $30k support:
Result: Support broke within hours!
Ready to practice price action on crypto markets?
Get up to $30,000 in bonusesWhile market structure shows you where price has been, price action reveals the market's current character and intentions. This distinction is crucial.
Price action is about reading the urgency or hesitation in current price movements. Here's a practical example from my own trading:
When price approaches a support level, I watch for:
Sharp bounces: Indicates strong buying interest
Grinding/hesitation: Suggests weakness
Violent breaks: Shows bears are in control
I once watched Bitcoin approach a major support at $30,000. Instead of bouncing sharply, it produced small, weak green candles – classic hesitation. This price action told me buyers weren't confident, and sure enough, the support broke within hours.
After analyzing thousands of charts, these five patterns consistently provide the best risk-reward opportunities:
The hammer has saved me from countless bad trades. Key requirements:
Appears after a downtrend
Long lower wick (at least 2x the body)
Small real body at the top
Even more powerful at support levels
The hammer's evil twin:
Forms after an uptrend
Long upper wick (at least 2x the body)
Small body at the bottom
Most effective at resistance zones
Dojis are the market's way of saying "I don't know":
Tiny or non-existent body
Can have long or short wicks
Multiple dojis often precede major moves
My personal favorite for catching reversals:
Two-candle pattern
Second green candle completely engulfs the first red candle's body
Stronger with volume confirmation
The bearish counterpart:
Second red candle engulfs the first green candle
Often marks significant tops
Watch for these at resistance levels
Indicators = Math Applied to Price
They CONFIRM trends, they don't PREDICT them
Price: Lower Low ↓
RSI: Higher Low ↑
Reversal Signal 🟢Price: Higher High ↑
RSI: Lower High ↓
Reversal Signal 🔴High Volume Breakout
Likely to sustain
Low Volume Rally
Often fails
Volume at S/R
Institutional activity
See these indicators in action with real-time data
30-day free trial + $15 bonusHere's a controversial truth: indicators are just math applied to price. They don't predict the future – they confirm what price is already telling you.
The Relative Strength Index measures momentum on a scale of 0-100:
Above 70: Potentially overbought (but can stay there in strong trends)
Below 30: Potentially oversold (can remain oversold in downtrends)
Divergence occurs when price makes a lower low, but RSI makes a higher low (bullish divergence) or vice versa. I've found this especially powerful when combined with support/resistance levels.
Volume tells you whether a move has conviction:
Breakouts with high volume are more likely to sustain
Low volume rallies often fail
Volume spikes at support/resistance reveal institutional activity
Chart patterns are the market's way of showing you collective trader psychology over extended periods.
The bull flag has been my most consistent pattern:
Strong upward move (the pole)
Slight pullback in a channel (the flag)
Breakout with volume confirms continuation
I typically enter on the breakout with stops below the flag's low, targeting at least 1.5x the risk.
Patterns work because they represent repeating human behavior. Fear, greed, and herd mentality don't change – that's why a head and shoulders pattern works today just as it did 50 years ago.
This is where most traders fail. You can be right about direction but still lose money with poor risk management.
The 1-2% Rule: Never risk more than 1-2% of your account on a single trade. This has saved my account multiple times during losing streaks.
Risk-Reward Ratios: I typically aim for at least 2:1 or 3:1 risk-reward. With a 3:1 ratio, you can be profitable winning just 25% of your trades.
Position Sizing Formula: Position Size = (Account Risk %) / (Stop Loss Distance %)
This simple formula has been a game-changer for consistent results.
After years of refinement, here's my exact process for every trade:
Define the Trend: Identify market structure (uptrend, downtrend, or range)
Mark Key Levels: Find major support and resistance zones
Analyze Price Action: How is price behaving at key levels?
Confirm with Indicators/Volume: Look for additional confluence
Set Risk Parameters: Define entry, stop-loss, and target before entering
This systematic approach removes emotion and improves consistency.
When analyzing NVIDIA, I noticed:
Clear support zone around $400
Bullish engulfing pattern at support
RSI divergence confirming reversal
Volume spike on the breakout
This confluence of signals provided a high-probability long setup with defined risk.
Silver showed a textbook bull flag:
Strong initial rally
Orderly pullback in a channel
Volume explosion on breakout
Clear stop below flag low
The trade hit a 3:1 risk-reward target within days.
Indicators confirm – they don't predict. Price action and market structure should always come first.
Always check multiple timeframes. A support on the 5-minute chart means nothing if you're breaking major support on the daily.
Every trade needs predetermined entry, stop, and target levels. "Hoping" is not a strategy.
Volume validates moves. Low volume breakouts fail more often than not.
Here's your action plan:
Choose Your Market: Start with one market (stocks, crypto, or forex)
Select Your Timeframe: Day trading (5-15 min), swing trading (4hr-daily), or investing (weekly)
Master the Basics: Focus on market structure and price action first
Add One Indicator: Start with RSI or moving averages
Paper Trade: Practice without real money until profitable
Start Small: When going live, trade minimal position sizes
TREND DIRECTION
Daily/Weekly Charts
ENTRY SIGNALS
4H/1H Charts
PRECISE ENTRIES
15M/5M Charts
Candlestick Patterns
Hammer, Doji, EngulfingTechnical Indicators
RSI, MACD, Moving AveragesEnhanced Accuracy
Monitor:
Monitor:
Combine these technical strategies with institutional-grade smart money insights for maximum edge
Get AI-powered smart money analysis
Save 70% today - Limited time offerAlways check at least three timeframes:
Higher timeframe for trend direction
Trading timeframe for entry signals
Lower timeframe for precise entries
Consider adding Japanese candlestick patterns with Western indicators for enhanced accuracy.
Watch correlated markets. For example, if trading gold, monitor the dollar index and bond yields.
TradingView is my go-to platform for all analysis. It offers:
Real-time data across all markets
Extensive indicator library
Community-shared strategies
Mobile and desktop sync
Practice on demo accounts before risking real money
Join trading communities for idea sharing
Keep a trading journal to track progress
Profitability timelines vary greatly depending on dedication, practice, and risk management. Most successful traders spend 6-12 months learning and paper trading before seeing consistent results. The key is to focus on the learning process rather than rushing to make money. Start with a demo account, develop a proven strategy, and only risk real capital once you've demonstrated consistent success over at least 3 months of practice.
Yes, technical analysis principles work across all liquid markets because they're based on human psychology and market dynamics, which remain consistent regardless of the asset. However, each market has unique characteristics. Crypto tends to be more volatile with 24/7 trading, forex has specific session times that affect volatility, and stocks can gap overnight. The core concepts apply universally, but you'll need to adjust your strategies for each market's specific behavior.
Price action should always be your primary focus, with indicators serving as confirmation tools. Price action shows you what's actually happening in the market right now, while indicators are mathematical calculations of past price movements. Successful traders typically master reading pure price action and market structure first, then add 1-2 indicators for additional confirmation. Think of indicators as your co-pilot, not your pilot.
You can start learning technical analysis with zero capital using demo accounts. When you're ready for real trading, the minimum depends on your market: forex allows micro lots (can start with $100-500), stocks depend on your broker (some allow fractional shares), and crypto can begin with as little as $50. However, having at least $1,000-2,500 gives you better risk management flexibility and helps avoid pattern day trader rules in stock markets.
Absolutely. Multiple timeframe analysis is crucial for understanding the complete market picture. Use a higher timeframe (daily/weekly) to identify the overall trend, your trading timeframe (4-hour/1-hour for swing trading, 15-min/5-min for day trading) for entry signals, and a lower timeframe for precise entries. This approach helps you trade with the larger trend while timing your entries more accurately.
The most common mistake is overcomplicating their charts with too many indicators, leading to analysis paralysis. Beginners often search for the "perfect" indicator instead of mastering the basics. Other critical mistakes include ignoring risk management, not having a trading plan, revenge trading after losses, and expecting immediate profitability. Focus on simplicity, consistency, and protecting your capital above all else.
Technical analysis is both an art and a science. While the concepts might seem overwhelming initially, remember that even professional traders use just a handful of reliable strategies repeatedly.
The key to success isn't finding the perfect indicator or pattern – it's about developing a systematic approach, managing risk properly, and maintaining discipline. Start with the basics I've outlined here: understand market structure, read price action, and always protect your capital.
Your journey to mastering technical analysis begins with your next chart. Open up your trading platform, apply these concepts, and start seeing the markets through the lens of probability and risk management rather than hope and fear.
Remember: every professional trader started exactly where you are now. The difference? They took action and remained committed to continuous learning.
Ready to take your trading to the next level? Start by mastering one concept at a time, and always practice with a demo account before risking real capital.
Disclaimer: This content is for educational purposes only and should not be considered financial advice. Trading involves substantial risk of loss. Always conduct your own research and consider your financial situation before making any investment decisions.
Deep dive into the most important market structure concepts that can transform your trading accuracy and timing.
Master the art of identifying key price levels to find the highest probability trading opportunities.
Everything you need to know about finding and trading the most important price levels in any market.
Advanced RSI strategies including divergence trading, momentum analysis, and optimal settings for different markets.
Trading & Investing Enthusiast
Teaching traders to understand market psychology, technical analysis, and investing through clear beginner-friendly insights.
Started investing at 16 and became fascinated by how market psychology influences price movements. Still learning something new every day.
Love sharing what I've learned along the way. There's nothing quite like helping someone understand a concept that once confused me too.
Proud to have built a community where traders actively share insights and grow together through daily market analysis and discussion.
Want to join our learning journey?
Real-time charts, RSI divergence alerts & practice on crypto markets 24/7