
The Complete Stochastic RSI Trading Strategy Guide: Master Advanced Settings & Divergence Patterns for 2025
Last Updated: December 11, 2025
Educational content for informational purposes only. Trading involves significant risk and this content should not be considered as direct financial advice.
The Stochastic RSI indicator has become one of the most powerful momentum oscillators for traders across forex, crypto, and stock markets. Unlike traditional indicators that simply follow price action, the Stochastic RSI provides deeper insights into momentum shifts that can help you anticipate market reversals and continuations before they become obvious to most traders.
In this comprehensive guide, you'll discover everything from basic concepts to advanced settings that most traders never learn about, including the powerful 5-3-3 and 21-14-14 configurations that can potentially transform your trading approach.
Understanding Stochastic RSI: Beyond Basic Momentum Analysis

What is the Stochastic RSI Indicator? The Stochastic RSI applies the stochastic oscillator formula to the normal RSI (Relative Strength Index). The Stochastic RSI ranges between 0 and 100 and signals overbought and oversold conditions.
The Stochastic RSI is fundamentally different from other momentum indicators because it measures shifts in momentum rather than momentum itself. While this might sound technical, understanding this distinction is crucial for successful implementation.
Think of momentum as the speed and direction of price movements. The Stochastic RSI tracks how this momentum changes over time by combining two powerful analytical concepts: the stochastic oscillator's range analysis with the RSI's momentum calculations.
The RSI Connection That Changes Everything
Here's where most explanations fall short: the Stochastic RSI actually tracks the RSI's position within its recent range. When I analyze charts, I focus on understanding that the Stochastic RSI shows where the RSI is relative to its recent highs and lows.
For example, when the Stochastic RSI reaches 100, it means the current RSI reading is at the highest point it's been during the lookback period (typically 14 periods). This relationship becomes incredibly valuable when you start recognizing patterns that indicate when momentum is about to shift.
The indicator oscillates between 0 and 100, with readings above 80 traditionally considered overbought and readings below 20 considered oversold. However, as you'll discover later, these traditional interpretations can lead to significant trading mistakes.
The Anatomy of Stochastic RSI: %K Line vs %D Line
Understanding the two main components of the Stochastic RSI is essential for proper implementation:
The %K Line (Fast Stochastic Line): This blue line shows the raw calculation of where the RSI sits within its range. It's highly responsive to price movements and provides the fastest signals.
The %D Line (Slow Stochastic Line): This orange line represents a 3-period moving average of the %K line. Since it's smoother, it provides more reliable signals but with slightly more delay.
The relationship between these lines creates the foundation for many trading strategies. When the %K line is above the %D line and both are rising, it often indicates strengthening upward momentum. Conversely, when the %K line falls below the %D line in a declining pattern, it may signal weakening momentum.
Critical Mistakes That Destroy Trading Accounts
Before diving into profitable strategies, let's address the two most dangerous misconceptions about Stochastic RSI trading:
Mistake #1: The Crossover Trap
Many traders believe that when the %K line crosses above the %D line, it's an automatic buy signal, and when it crosses below, it's a sell signal. This approach leads to numerous false signals and can quickly erode trading capital.
The reality is that these crossovers occur frequently and often don't align with meaningful price movements. During strong trends, you might see multiple crossovers that would have you entering and exiting positions repeatedly, often at the worst possible times.
Mistake #2: The Overbought/Oversold Fallacy
The second critical mistake involves treating overbought conditions (above 80) as immediate sell signals and oversold conditions (below 20) as automatic buy signals. This approach ignores a fundamental truth about trending markets: strong trends can remain overbought or oversold for extended periods.
During powerful uptrends, the Stochastic RSI may stay above 80 for weeks or even months. Similarly, during severe downtrends, it can remain below 20 for extended periods. Trading against these conditions often means fighting the dominant market forces.
The Power of Stochastic RSI Divergence Trading
The most reliable Stochastic RSI strategy revolves around divergence analysis. This approach focuses on identifying when price action and momentum are moving in opposite directions, often signaling potential reversals or continuations.
Stochastic RSI Divergence Quick Reference
🟢 Regular Bullish
Price: Lower lows
Stoch RSI: Higher lows
Signal: Potential upward reversal
🔴 Regular Bearish
Price: Higher highs
Stoch RSI: Lower highs
Signal: Potential downward reversal
🎯 Pro Trading Tips
- Use %D Line: More reliable than %K for divergence analysis
- Focus Rule: Bullish divergences → analyze lows only | Bearish divergences → analyze highs only
- Confirmation: Always wait for price action confirmation before entering trades
Find Automatic Divergences in TradingView
Stop missing signals! TradingView offers powerful indicators that automatically detect Stochastic RSI divergences for you.
Get TradingView Premium + $15 Bonus → 30-day free trial includedTypes of Divergences and What They Mean
Regular Bullish Divergence: Price makes lower lows while the Stochastic RSI makes higher lows. This pattern suggests weakening downward momentum and potential reversal to the upside. The key insight here is that selling pressure is diminishing even as prices continue to fall.
Hidden Bullish Divergence: Price makes higher lows while the Stochastic RSI makes lower lows. This occurs during uptrends and suggests the upward movement will continue. It's particularly powerful because it indicates that despite temporary weakness, the underlying bullish momentum remains intact.
Regular Bearish Divergence: Price makes higher highs while the Stochastic RSI makes lower highs. This warns of weakening upward momentum and potential reversal to the downside. Even though prices are reaching new highs, the momentum behind the move is deteriorating.
Hidden Bearish Divergence: Price makes lower highs while the Stochastic RSI makes higher highs. This pattern appears during downtrends and suggests continuation of the bearish movement.
Practical Divergence Analysis
When analyzing divergences, I focus primarily on the %D line rather than the %K line for standard settings. The %D line provides clearer divergence signals because it's less likely to give false readings due to its smoothed nature. The %K line tends to hit extreme values frequently, making divergence patterns harder to identify reliably.
Remember this crucial rule: for bullish divergences, only analyze the lows; for bearish divergences, only analyze the highs. This focused approach prevents confusion and improves signal accuracy.
Advanced Stochastic RSI Settings That Professionals Use
Most traders stick with default settings, but understanding how to adjust the Stochastic RSI for different market conditions and timeframes can significantly improve your results.
Professional Stochastic RSI Settings Guide
5-3-3 Setting
Short-Term Precision
Best For: Day trading, 5-15 min charts
Advantage: Faster signals, clear divergences
Trade-off: More noise, requires confirmation
21-14-14 Setting
Long-Term Perspective
Best For: Swing trading, daily/weekly charts
Advantage: Fewer false signals, major trends
Trade-off: Slower response, requires patience
📊 Quick Comparison
🎯 Professional Implementation Tips
- Always Backtest: Test settings on historical data before live trading
- Market Adaptation: Volatile markets may benefit from faster settings
- Confirmation Required: Never trade on Stochastic RSI signals alone
- Risk Management: Faster settings require tighter stop losses
Access Advanced Indicators in TradingView
Get automatic divergence detection, custom Stochastic RSI variations, and professional-grade backtesting tools with TradingView Premium.
Start Free Trial + Get $15 Bonus → Access 100+ premium indicators and advanced chartingThe 5-3-3 Setting: Short-Term Precision
This configuration is designed for day traders and those working with shorter timeframes like 5-minute or 15-minute charts:
Stochastic Length: 5 (instead of the default 14)
%K: 3
%D: 3
By reducing the stochastic length to 5, the indicator becomes much more sensitive to recent price movements. This creates faster, more responsive signals that can help capture quick momentum shifts in volatile markets.
The advantage of this setting is that divergences become more apparent and signals arrive earlier. However, the trade-off is increased sensitivity to market noise, which can lead to more false signals. This setting works best when combined with strong price action confirmation and proper risk management.
The 21-14-14 Setting: Long-Term Perspective
For swing traders and position traders working with daily or weekly timeframes, this configuration provides more reliable but slower signals:
Stochastic Length: 21
%K: 14
%D: 14
RSI Length: 14
This setting creates a much smoother indicator that's less prone to false signals but requires patience. The longer lookback periods help filter out short-term noise and focus on more significant momentum shifts.
When backtesting this configuration on weekly Bitcoin charts, it has historically provided excellent early warnings of major trend changes, including identifying potential reversals at significant market tops and bottoms.
Automatic Divergence Detection
For traders who want to systematically identify divergence patterns, there are specialized indicators that automatically detect and mark divergences on your charts. These tools can save time and help ensure you don't miss important signals, especially when monitoring multiple markets simultaneously.
However, remember that not all automatically detected divergences will result in successful trades. The indicator should be used as a scanning tool rather than an automatic trading system.
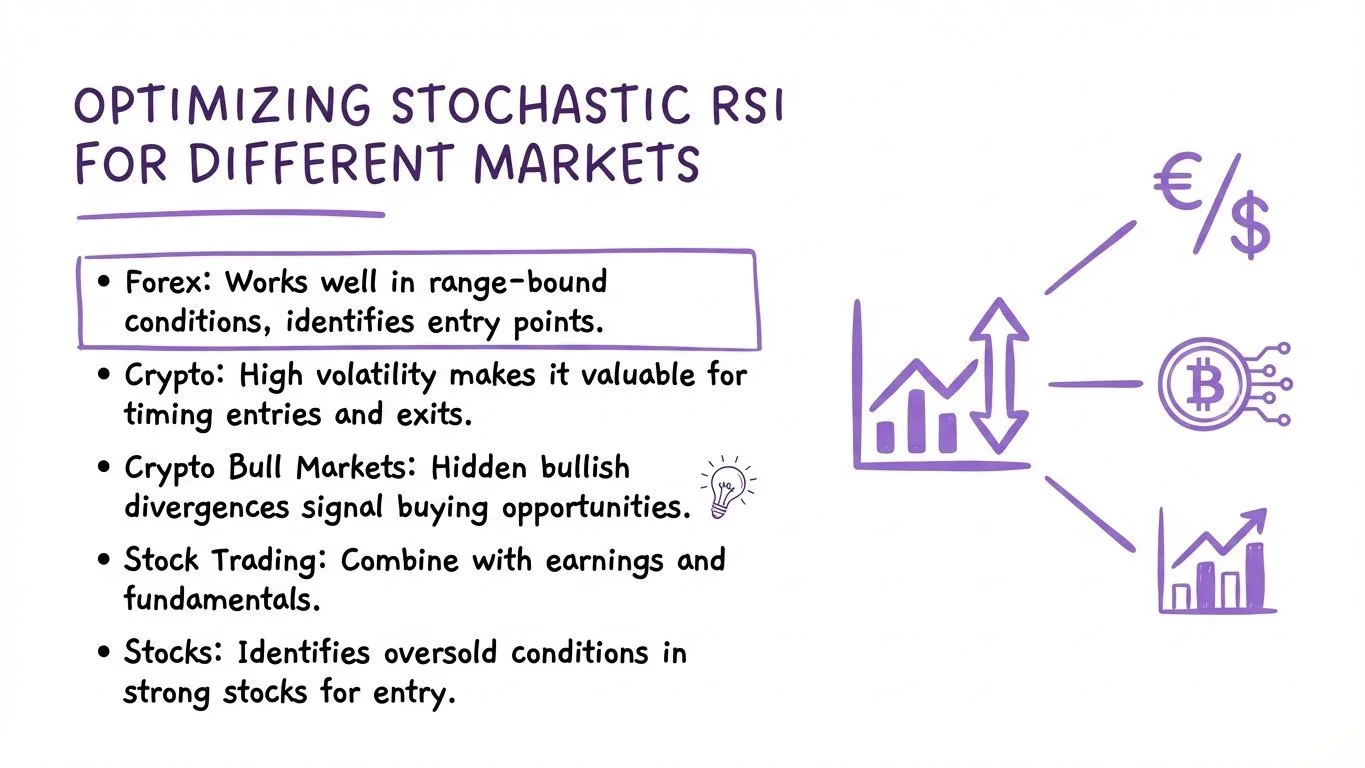
Optimizing Stochastic RSI for Different Markets
Stochastic RSI Indicator Optimization
Forex Market Applications
In forex trading, the Stochastic RSI works particularly well during range-bound conditions and can help identify optimal entry points during trend continuations. The 5-3-3 setting often works well for scalping major currency pairs during active trading sessions.
For swing trading forex, consider using the standard 3-3-14 settings but pay special attention to divergences that align with key support and resistance levels.
Cryptocurrency Trading Strategies
Crypto markets' high volatility makes the Stochastic RSI especially valuable for timing entries and exits. The indicator's sensitivity to momentum shifts helps navigate the rapid price movements common in digital assets.
During crypto bull markets, hidden bullish divergences on higher timeframes can signal excellent buying opportunities during pullbacks. Conversely, regular bearish divergences often provide early warnings before significant corrections.
Stock Market Implementation
For stock trading, combine Stochastic RSI analysis with earnings calendars and fundamental factors. The indicator works well for identifying technically oversold conditions in fundamentally strong stocks, providing attractive risk-reward entry opportunities.
Risk Management and Confirmation Strategies
Never rely solely on Stochastic RSI signals. The most successful approaches combine momentum analysis with:
Price Action Confirmation: Wait for candlestick patterns or break of key levels to confirm Stochastic RSI signals.
Market Structure Analysis: Ensure your trades align with the broader market context and trend direction.
Volume Analysis: Strong divergences accompanied by increasing volume often provide more reliable signals.
Multiple Timeframe Analysis: Confirm shorter-timeframe signals with longer-timeframe trend direction.
📋 Stochastic RSI Trade Setup Checklist
Complete this checklist before every trade entry
Market Context Analysis
Stochastic RSI Signal Quality
Confirmation Factors
Risk Management
Entry Execution
Common Questions and Troubleshooting
Why do my Stochastic RSI signals fail during strong trends? Strong trends can maintain extreme readings for extended periods. Focus on hidden divergences during trends rather than trying to pick tops and bottoms.
Should I use %K or %D line for divergences? For standard settings, the %D line typically provides clearer divergence signals. However, with faster settings like 5-3-3, the %K line can be more responsive.
How do I avoid false breakouts when trading divergences? Wait for price confirmation beyond key levels and consider the broader market context. Not every divergence leads to immediate reversals.
Advanced Tips for Consistent Results
Context is King: Always consider the broader market environment. Divergences in trending markets often signal continuations rather than reversals.
Timeframe Alignment: Use divergences on higher timeframes to guide your overall bias, then look for entry signals on lower timeframes.
Patience Pays: Not every divergence requires action. Wait for the highest-probability setups that align with your trading plan.
Backtest Rigorously: Before implementing any new settings or strategies, thoroughly backtest them on historical data in your chosen markets.
Stochastic RSI Indicator FAQ
Stochastic RSI Frequently Asked Questions
What's the difference between Stochastic RSI and regular RSI?
The Stochastic RSI measures where the RSI sits within its recent range, making it more sensitive to momentum changes. While RSI oscillates based on price closes, Stochastic RSI tracks the RSI's position relative to its highs and lows over a specific period, providing faster and more responsive signals for momentum shifts.
Should I use the %K line or %D line for trading signals?
For standard settings, the %D line typically provides more reliable signals because it's a smoothed version of the %K line, reducing false signals. However, with faster settings like 5-3-3, the %K line can be more responsive. For divergence analysis, many professionals prefer the %D line as it creates clearer patterns.
What are the best Stochastic RSI settings for day trading?
The 5-3-3 setting (Stochastic Length: 5, %K: 3, %D: 3) works well for day trading on shorter timeframes like 5-minute or 15-minute charts. This configuration provides faster, more responsive signals suitable for capturing quick momentum shifts in volatile markets.
Why do overbought and oversold signals often fail?
During strong trends, the Stochastic RSI can remain overbought (above 80) or oversold (below 20) for extended periods. Treating these conditions as automatic reversal signals ignores the power of trending markets. Instead, focus on divergence patterns and use overbought/oversold levels as context rather than direct trading signals.
How do I identify reliable divergence patterns?
Focus on clear divergences where price and indicator move in opposite directions over multiple periods. For bullish divergences, look for lower lows in price with higher lows in the Stochastic RSI. For bearish divergences, identify higher highs in price with lower highs in the indicator. Always wait for price action confirmation before entering trades.
Can Stochastic RSI work for cryptocurrency trading?
Yes, Stochastic RSI is particularly effective in crypto markets due to their high volatility. The indicator's sensitivity to momentum shifts helps navigate rapid price movements. Hidden bullish divergences during crypto bull markets often signal excellent buying opportunities during pullbacks, while bearish divergences can provide early warnings before corrections.
Quiz: Test Your Stochastic RSI Trading Knowledge!
Test Your Stochastic RSI Knowledge
Building Your Stochastic RSI Trading Plan
Start by determining which timeframes and markets you'll focus on, then select the appropriate Stochastic RSI settings. Practice identifying divergences on historical charts before risking capital, and always maintain strict risk management protocols.
Remember that the Stochastic RSI is a tool for analysis, not a crystal ball. Combine it with solid trading fundamentals, proper position sizing, and realistic expectations for the most sustainable long-term results.
The key to success with Stochastic RSI lies not in finding the perfect settings, but in understanding how momentum shifts relate to price action and market psychology. Master these concepts, and you'll have a powerful analytical tool that can enhance your trading across any market condition.
Test Your Stochastic RSI Knowledge
Want to join our learning journey?