

The Pivot Point Trading Strategy: How to use the TradingView Pivot Point Indicator
Pivot points are a powerful tool in technical analysis, helping traders identify key support and resistance levels in the market. This guide explores how to use the Pivot Points High Low indicator on TradingView, offering step-by-step instructions, practical examples, and tips for configuring the indicator to maximize its effectiveness.
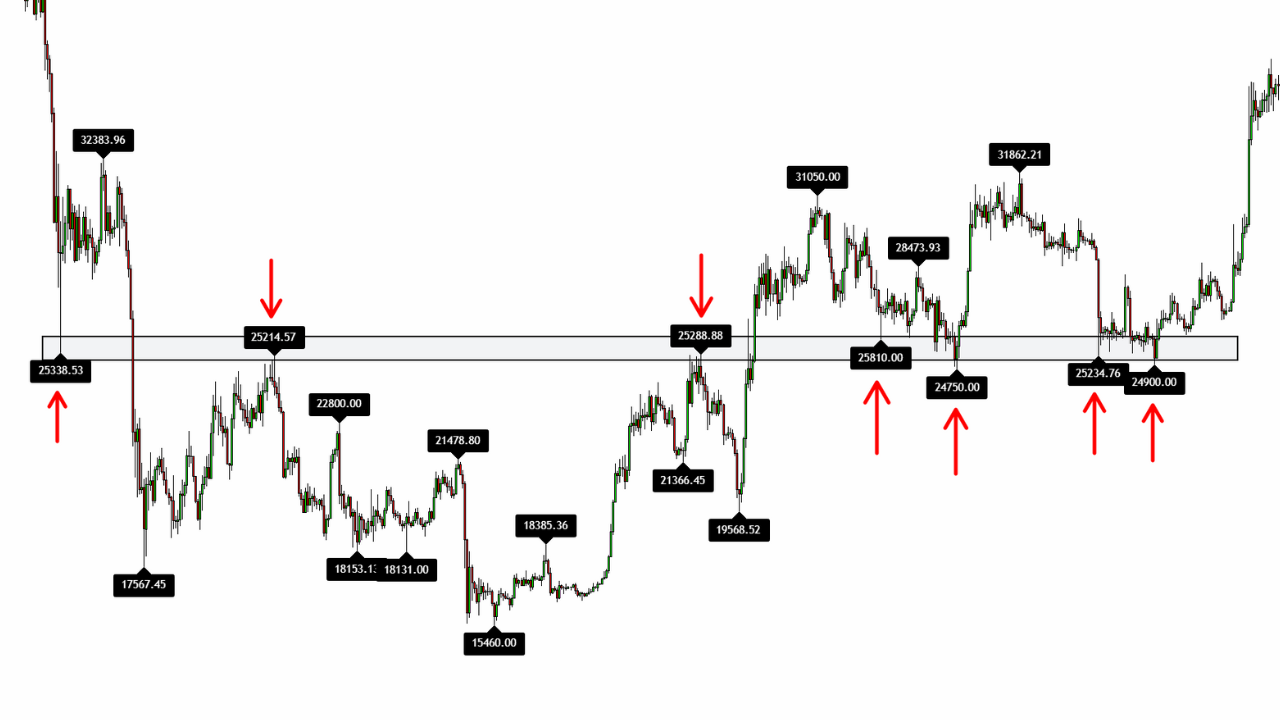
Support and Resistance TradingView Indicator: The Pivot Point Trading Strategy
The Pivot Points High and Low Indicator is one of the most effective tools on TradingView for identifying key support and resistance levels. In this article, you'll learn how to set it up and use it step-by-step to potentially improve your trading strategy.
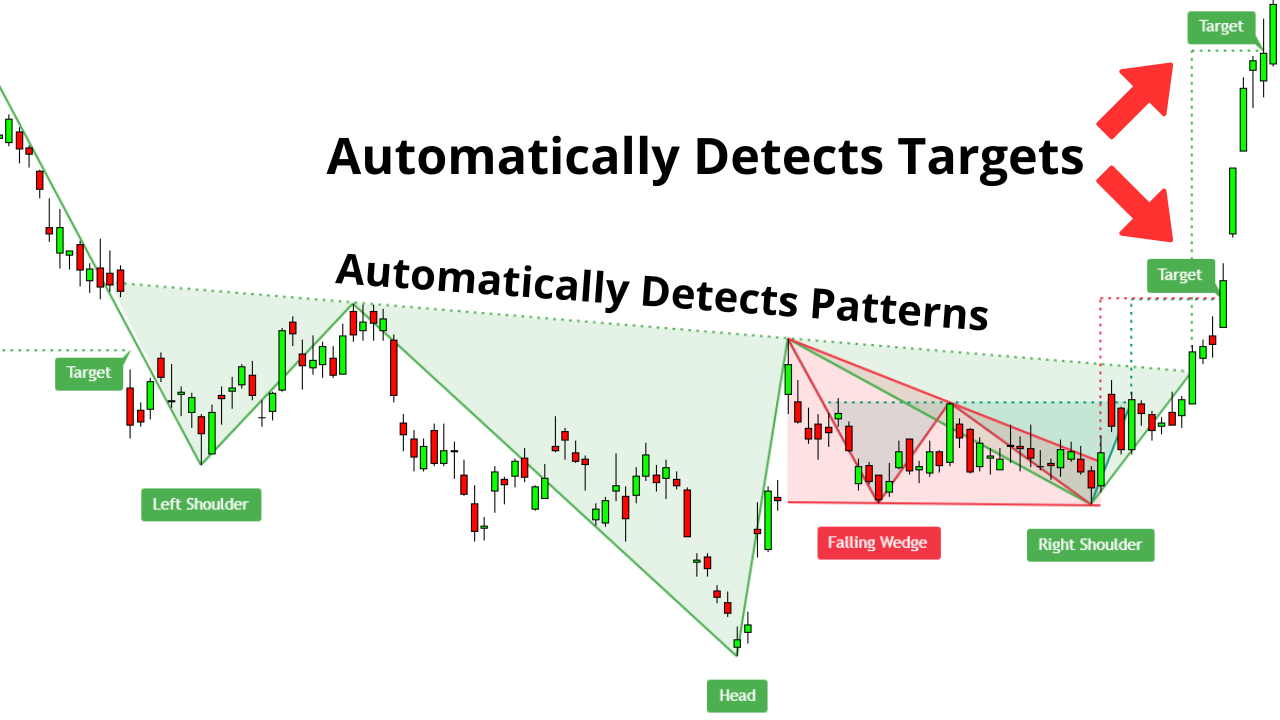
The Auto Chart Patterns TradingView Indicator: A Comprehensive Guide
The Auto Chart Patterns TradingView Indicator is one of the most powerful tools for automated chart pattern recognition. In this comprehensive guide, you'll learn how to use this premium indicator to identify profitable trading setups like head and shoulders, double tops, and wedges without manual analysis.

The RSI Indicator: How to use the RSI Indicator (Relative Strength Index) for Trading Crypto, Forex, and Stocks.
In this article, you'll learn everything about the RSI Indicator (Relative Strength Index) — what it is, how it relates to momentum, RSI divergences, and much more!

The Arnaud Legoux Moving Average (ALMA): Moving Average Trading
Master the ALMA (Arnaud Legoux Moving Average) indicator to elevate your trading strategy with a blend of smoothness and responsiveness. In this comprehensive guide, we delve into the unique features of ALMA, comparing it with other popular moving averages like SMA, EMA, and HMA. Learn how to set up and optimize ALMA for various market conditions, from volatile cryptocurrencies to stable blue-chip stocks.