
Master Bollinger Bands: The Complete Trading Guide 2025
Learn how Bollinger Bands complement the ADX for identifying volatility and trend strength together.
Prefer watching over reading? This YouTube video covers everything about the ADX indicator - from finding it in TradingView to implementing a complete ADX indicator trading strategy. See the optimal settings and real chart examples in action.
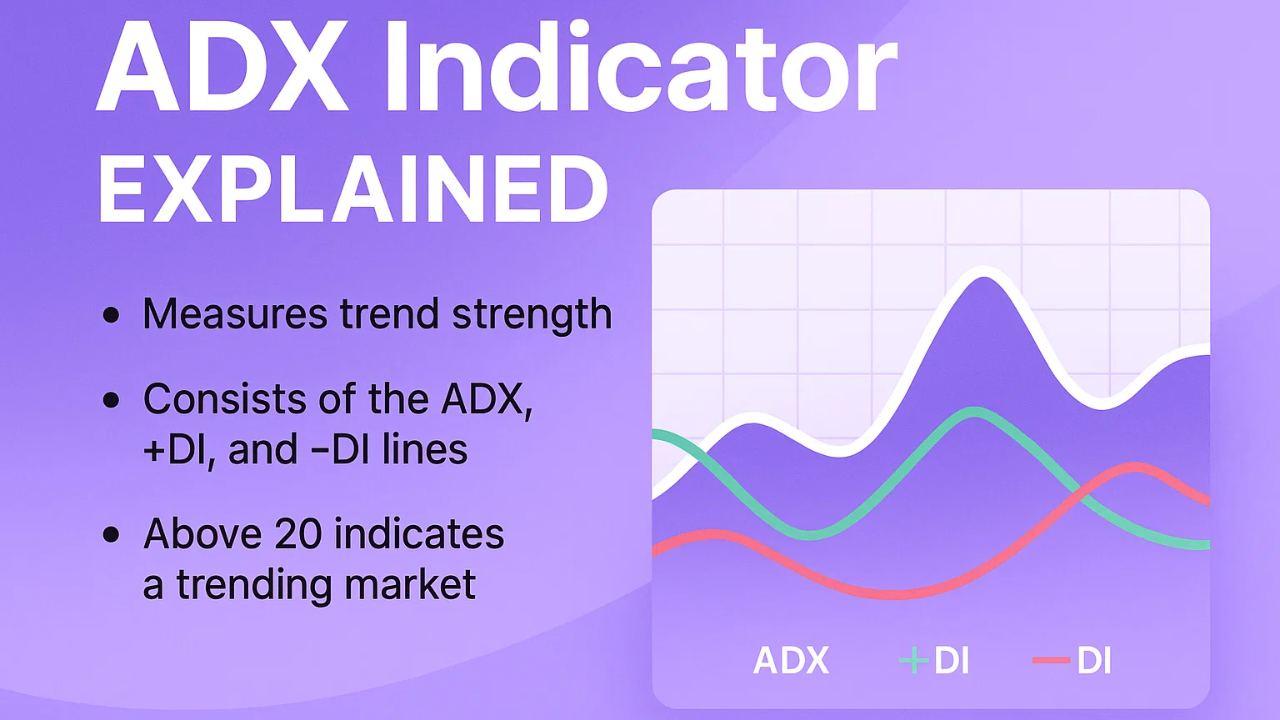
The ADX measures trend strength, not direction - high values indicate strong trends whether bullish or bearish, making it essential to check the DI lines for trend direction.
Set your ADX threshold between 25-30 for more reliable signals, avoiding the default 20 which can produce too many false signals in most markets.
Combine ADX with DMI indicators initially to understand the relationship - when DI lines diverge, ADX rises; when they converge, ADX falls.
Adjust the ADX length based on your trading style: 7 for day trading (faster signals), 14 for standard trading, and 20-28 for swing/position trading.
The most effective ADX strategy combines trend strength confirmation with price action signals and market structure analysis for high-probability trade entries.
Most traders completely misunderstand the ADX indicator. They see it as a simple buy and sell indicator, but I've discovered it's actually much deeper than that. After years of using the Average Directional Index in my trading, I can tell you that when you truly understand how it works and combine it with proper price action analysis, it becomes one of the most powerful tools in your trading arsenal.
In this comprehensive guide, you'll learn exactly how to find the correct ADX indicator in TradingView (which can actually be pretty hard), understand what it really measures, and master a proven ADX trading strategy that can help you identify high-probability trades. Whether you're trading crypto, stocks, or forex, this guide will transform how you approach trend trading.
The ADX indicator can work on pretty much every asset type and most timeframes, though I recommend avoiding the very small timeframes like the 1-minute chart, especially if you're trading low liquidity markets. Let's dive into everything you need to know about mastering the ADX indicator.
Open TradingView → Indicators → Search "ADX" → Select first result (Average Directional Index)
Indicators → Search "DMI" → Add Directional Movement Index for complete analysis
Wide DI spread = High ADX (strong trend) | Tight DI spread = Low ADX (weak trend)
Ready to implement this ADX setup?
Start Free Trial Get 30 days free + $15 bonusFinding the right ADX indicator in TradingView isn't as straightforward as you might think. Here's exactly how I set it up for maximum effectiveness:
First, open a clean chart in TradingView. Navigate to the indicators tab and search for "ADX." You'll see that ADX stands for Average Directional Index, and the first indicator that appears is the normal ADX indicator. This one looks super simple - just a single line that might remind you of an RSI or other one-line indicator.
However, here's what I highly recommend, especially when you're learning the ADX: you'll want to open up an additional indicator. Go back to the indicators tab and search for "DMI" (Directional Movement Index). This is crucial because when you open the DMI settings by clicking the settings cog wheel, you'll notice something interesting - it actually includes an ADX line along with lines called D+ (plus DI) and D- (minus DI).
Here's a pro tip I've learned through experience: use both indicators initially. You'll have the standalone ADX indicator and the DMI indicator running simultaneously. This setup helps you understand the relationship between them. What you'll notice relatively quickly is that the more space between the blue and orange lines (the DI lines), the higher the ADX will go. When there's tight space between the lines, you'll have a very low ADX value.
For clarity, I always change my plus DI to a green line and make it slightly bigger, while changing the minus DI to a red line. Why? The green line represents bullish pressure, and the red line represents bearish pressure. This visual distinction makes reading the market much easier. I also change the ADX line itself to orange so you don't mix it up with the other lines.
ADX Indicator Explained
In very simple terms, the ADX measures the strength of a trend - but here's what catches most traders off guard: it doesn't tell you the direction of the trend. This is absolutely critical to understand.
When you see a very strong trend, like the recent strong downtrend we've been experiencing in the stock market, you'll notice very high values on the ADX. But here's the key insight: you'll have high ADX values both during strong downtrends AND strong uptrends. Looking at historical data, during strong bullish trends at their peak strength, we still see high ADX values even though the market was moving up.
This relationship stems from the fact that the ADX measures the space between the DI lines. It doesn't matter if the bears or bulls are in control - you can identify who's in control by looking at which DI line is on top. When the red line (minus DI) is above the green line, bears are in control. When the green line is above, bulls are in control. The ADX simply tells you the strength of whichever trend is occurring, whether bearish or bullish.
Understanding this distinction can save you from costly trading mistakes. I've seen too many traders assume a rising ADX means they should buy, when in reality, it could be signaling a strong downtrend. The ADX is trend-strength agnostic - it only cares about how strong the trend is, not which direction it's going.
Pro Strategy: Using ADX to filter markets can improve your win rate dramatically - knowing when NOT to trade is just as valuable as knowing when to trade.
Practice these strategies risk-free with up to $30,000 in bonuses
Start on Bybit No KYC • Instant deposits • Advanced chartingThrough my trading experience, I've identified two very clear and easy use cases for the ADX. These use cases are essentially the same concept viewed from opposite angles:
The first use case is using the ADX to find strong trending markets. If you're a trader who focuses on pullbacks - maybe even pullbacks in downtrends - you can use the ADX to filter out the best trends. When the ADX is rising and above your threshold (which we'll discuss in the settings section), you know you're in a trending environment where pullback strategies can be highly effective.
For example, in the recent bearish trend we've been experiencing, the ADX has been showing high values, though I've noticed it's starting to lose some steam - definitely something to pay attention to. This high ADX reading confirms we're in a strong trend environment suitable for trend-following strategies.
Here's where the ADX becomes invaluable: you can use it to identify markets you DON'T want to trade. If you're a trend trader, you want to avoid markets where price is very choppy and random, perhaps moving in a trading range. As a trend trader, when the ADX is very low (below 20-25), that's your signal to stay out or switch to range-trading strategies.
This filtering capability alone can dramatically improve your win rate by keeping you out of unfavorable market conditions. I've found that avoiding low-ADX environments as a trend trader is just as important as finding high-ADX opportunities.
Higher threshold = Fewer but higher quality signals
Access advanced indicators and unlimited alerts
30-day trial + $15 upgrade bonusLet me share the optimal ADX settings I've discovered through extensive testing. To have more room to work with, I recommend using the built-in "ADX and DI" indicator in TradingView, which combines both the ADX and DMI into one indicator.
The first critical setting is the threshold level (TH). The standard value is 20, and you'll see a dotted line at this level. However, through my experience, I've found that keeping the threshold at 20 results in many false signals.
I personally recommend increasing the threshold to at least 25, with some traders preferring 30. Let me demonstrate why: at a threshold of 25, the recent downtrend we've been tracking took a while to breach the threshold level, but once it did, it accurately caught the downtrend. If you lower the threshold to 15 or even 20, you'll get so many false signals that the threshold becomes practically useless. A higher threshold between 25 to 30 is my rule of thumb for most markets.
The next crucial setting is the length (or "len"). The standard length is 14, which I actually think works well since it's the standard for many other indicators like RSI and ATR. However, this depends on your trading style:
For Day Traders: If you're trading the 5-minute or 15-minute timeframe and want faster signals (accepting that you'll get more false signals), a common setting is to reduce the length to 7. This makes the indicator more responsive to recent price action.
For Swing/Position Traders: If you're more of a swing trader or position trader, you might find 14 is too short. When trading the daily or weekly timeframe, many traders increase the length to 20, with some going up to 28. This smooths out the indicator and reduces noise.
The key is to experiment with different settings and backtest them to find what fits your specific market and trading style best. For this guide, I'll stick with the balanced settings of length 14 and threshold 25.
Now let's dive into the ADX trading strategy that combines the indicator with price action and market structure. You'll need the ADX indicator and solid knowledge of price action and market structure for this to work effectively.
This trading strategy uses the ADX as a trend filter. When the ADX line is above our threshold of 25, we know we're in a trending market or at least that a trending market is starting to form. The second element we look for is a pullback within that trend.
In trends, we see a pattern of impulsive moves followed by pullbacks. In a downtrend: impulsive move down, pullback up, impulsive move down, pullback up. It's the exact same pattern but reversed in an uptrend.
Let me walk you through a beautiful example I actually discussed in an earlier video before it played out. We had a powerful impulsive move down, followed by a textbook pullback - what's also known as a bear flag. Here, two critical conditions aligned:
The ADX showed strength above our threshold
We had a clear bear flag pattern forming
This combination of ADX strength with market structure creates a high-probability setup.
There are two main entry approaches I use:
Entry Method 1 - Price Action Signal: Look for a price action pattern at the resistance of the flag. In our example, we had a bearish engulfing pattern forming right at the bear flag resistance. This provides a clear entry signal with defined risk.
Entry Method 2 - Breakout Entry: Enter when price breaks below the bear flag structure. This confirms the continuation of the trend, though your entry might be slightly later than the price action method.
For the breakout entry, place your stop loss just above the high of the pullback. With a conservative 1.5 risk-to-reward ratio, your trade setup is clearly defined.
If you use the price action entry (at the bearish engulfing candle close), set your stop loss just above the highest point of the pullback. With a 1.5 risk-to-reward ratio, you have a clear profit target, and with a 2:1 risk-to-reward, you can capture even more of the move while maintaining favorable odds.
The real power of this strategy comes from combining the ADX with solid market structure analysis. The ADX confirms you're in a trending environment, while price action and structure patterns provide specific entry points. This dual confirmation significantly increases your probability of success.
Through years of using the ADX indicator, I've learned several practical tips that can dramatically improve your results:
Check multiple timeframes to avoid false entries
Signals trend exhaustion & potential reversal
Wait for pullbacks when RSI overbought + high ADX
Adjust thresholds for market volatility
Master Tip: Combining these techniques creates a robust trading system that adapts to different market conditions and reduces false signals.
Practice on multiple markets with different volatility levels
Up to $30,000 in bonuses • Advanced charting • All marketsAlways check the ADX on multiple timeframes. If the daily chart shows ADX above 25 but the 4-hour chart shows ADX below 20, you might be looking at a larger trend that's currently consolidating. This multi-timeframe perspective helps you avoid entering during temporary pauses in the trend.
Watch for ADX divergence - when price makes new highs or lows but the ADX doesn't confirm with higher readings. This often signals trend exhaustion and potential reversal points. I've noticed in recent market action that while prices continue trending, the ADX is starting to lose steam, suggesting we might see a change soon.
The ADX works exceptionally well when combined with momentum indicators like RSI or MACD. For example, if ADX shows a strong trend but RSI shows overbought conditions, you might wait for a pullback before entering.
Different markets respond differently to ADX readings. Forex pairs might show strong trends at ADX 30, while volatile cryptocurrencies might need ADX above 40 to confirm a strong trend. Always adjust your interpretation based on the specific market you're trading.
Let me share the most common mistakes I see traders make with the ADX indicator:
Many traders only look at the ADX line and ignore the plus and minus DI lines. This is like driving with one eye closed. The DI lines tell you who's in control (bulls or bears) and help confirm the ADX reading. Always use them together for complete market analysis.
When the ADX is below 20-25, the market is essentially telling you there's no clear trend. Trying to apply trend-following strategies in these conditions is like trying to surf without waves - it simply won't work.
The ADX is powerful, but it shouldn't be your only tool. Always combine it with price action, support and resistance levels, and other forms of analysis. The ADX tells you about trend strength, but you need other tools to identify entry and exit points.
Using the ADX on very small timeframes like 1-minute charts, especially in low liquidity markets, produces too much noise. Stick to 5-minute charts and above for more reliable signals.
The ADX (Average Directional Index) measures trend strength regardless of direction, showing values from 0-100. The DMI (Directional Movement Index) includes the ADX line plus two additional lines: +DI (bullish pressure) and -DI (bearish pressure). The DMI gives you a complete picture - both trend strength and direction - while the standalone ADX only shows strength. For beginners, using both together helps understand their relationship better.
Generally, an ADX value above 25 indicates a trending market, while values above 40 suggest a very strong trend. Values below 20 typically indicate a weak or non-existent trend, suggesting ranging or choppy market conditions. However, these thresholds can vary by market - cryptocurrencies might need higher values due to their volatility, while forex pairs might show strong trends at lower ADX readings.
The ADX itself doesn't predict reversals since it only measures trend strength, not direction. However, ADX divergence (when price makes new highs/lows but ADX doesn't confirm with higher readings) can signal trend exhaustion. Additionally, when ADX starts declining from high levels (above 40-50), it often indicates the current trend is losing momentum, though this doesn't necessarily mean an immediate reversal.
The ADX works effectively on timeframes from 5 minutes and above. For day trading, 5-minute to 1-hour charts work well with a shorter ADX length (7-10). For swing trading, daily and 4-hour charts with standard settings (14 length) are ideal. Avoid using ADX on 1-minute charts, especially in low liquidity markets, as it produces too many false signals due to market noise.
While the ADX is powerful, it works best when combined with other tools. Use it with price action analysis for entry/exit points, support/resistance levels for context, and momentum indicators like RSI or MACD for confirmation. The ADX tells you about trend strength, but you need other tools to identify specific trading opportunities and manage risk effectively.
In TradingView, search for "ADX and DI" to get the combined indicator. Set the threshold to 25-30 (not the default 20), keep the length at 14 for standard trading or adjust to 7 for day trading or 20-28 for position trading. Color the +DI line green for bullish pressure and -DI line red for bearish pressure. This visual setup makes it easier to quickly identify both trend strength and direction.
The ADX indicator, when properly understood and applied, can transform your ability to identify and trade trends effectively. Remember, it measures trend strength, not direction - a critical distinction that separates successful traders from those who struggle.
By combining the ADX with solid price action analysis and market structure understanding, you create a robust trading approach that can work across different markets and timeframes. The key settings I've shared (threshold 25-30, length adjusted for your trading style) provide a solid foundation, but always remember to test and adapt them to your specific trading context.
Start by practicing with both the ADX and DMI indicators visible, as this will deepen your understanding of how trend strength develops. As you become more comfortable, you can streamline your setup while maintaining the edge this powerful indicator provides.
The beauty of the ADX lies not just in finding strong trends to trade, but equally in helping you avoid choppy, directionless markets that can erode your capital. This dual capability makes it an essential tool in any serious trader's arsenal.
Ready to take your trading to the next level? Consider getting TradingView Premium for free for 30 days and receive a $15 bonus if you decide to upgrade. This will give you access to all the advanced features needed to implement this ADX strategy effectively.
Remember, successful trading isn't about finding the perfect indicator - it's about understanding the tools you use and applying them within a comprehensive trading plan. The ADX indicator can be a powerful component of that plan when used correctly.
Disclaimer: This content is for educational purposes only and should not be considered financial advice. Trading involves substantial risk of loss. Always conduct your own research and consider your financial situation before making any investment decisions.
Learn how Bollinger Bands complement the ADX for identifying volatility and trend strength together.
Master the RSI indicator to identify overbought/oversold conditions while ADX confirms trend strength.
Combine MACD momentum signals with ADX trend strength for powerful trading confirmation.
Master volatility measurement with ATR to set perfect stop losses for your ADX trend trades.
Trading & Investing Enthusiast
Teaching traders to understand market psychology, technical analysis, and investing through clear beginner-friendly insights.
Started investing at 16 and became fascinated by how market psychology influences price movements. Still learning something new every day.
Love sharing what I've learned along the way. There's nothing quite like helping someone understand a concept that once confused me too.
Proud to have built a community where traders actively share insights and grow together through daily market analysis and discussion.
Want to join our learning journey?
Filter trending markets & avoid choppy conditions with precision ADX settings