
Master Support and Resistance Trading: Complete Guide for All Markets 2025
Discover how to identify and trade key price levels across all markets, including dynamic support and resistance concepts.
Prefer watching? No worries, in this YouTube video you will learn everything you need to know about the trendline trading strategy, from what a trendline is to identifying quality touches, recognizing warning signs of trend line failure, and executing profitable breakout trades. I'll also share my pro tip for creating trend channels and demonstrate real examples using Bitcoin charts.
Trend lines are dynamic support and resistance levels that connect significant highs or lows, helping traders identify and follow market trends across all timeframes
Quality matters more than quantity when validating trend lines - focus on strong reactions, volume confirmation, and well-spaced touches rather than simply counting touches
Think of trend lines as zones rather than precise lines, as price rarely respects exact levels in real market conditions
Warning signs of trend line failure include price clustering, weak reactions, failure to make new highs/lows, and overly steep angles that indicate unsustainable momentum
Successful trend line trading requires combining this tool with other analysis methods like price action, market structure, and volume analysis for confirmation
Finding and drawing trend lines might seem incredibly simple at first glance. After all, you just need to connect two points on a chart and draw a line, right? As I've discovered through years of trading, if it were truly that easy, everyone would be a successful trader. The reality is that effective trend line trading requires a much deeper understanding of market dynamics, price action, and the subtle nuances that separate profitable traders from the rest.
In this comprehensive trend line trading guide, I'll show you not just how to draw trend lines correctly, but more importantly, the critical signs and rules you need to recognize when using them in your trading strategy. These insights can help you potentially improve your trading results when applied with proper risk management.
Before we can master drawing trend lines, we need to establish a solid understanding of what constitutes a trend in trading. In simple terms, a trend represents the overall direction of price movement over time.
1. Uptrend (Bullish Market) An uptrend is characterized by both higher highs and higher lows. The price creates what we call impulsive moves upward, followed by pullbacks that form higher lows. It's crucial to understand that both elements must be present - having only higher highs without higher lows doesn't constitute a valid uptrend.
2. Downtrend (Bearish Market)
The opposite is true for downtrends. We need to see both lower highs and lower lows. Each rally fails to exceed the previous high, and each decline pushes below the previous low, creating a stair-stepping pattern downward.
3. Sideways Trend (Trading Range) Also known as a consolidation or ranging market, this occurs when the market lacks clear direction. Price oscillates between support and resistance levels without establishing higher highs/lows or lower highs/lows.
One fascinating aspect of trends that many new traders overlook is their fractal nature. Trends exist across multiple timeframes simultaneously. Within every impulsive move on a daily chart, you'll find smaller trends on the hourly charts. Similarly, within pullbacks on the hourly chart, you'll discover micro-trends on the 15-minute timeframe.
This multi-timeframe characteristic means you can apply trend line analysis whether you're swing trading on daily charts or scalping on 5-minute charts. The principles remain consistent across all timeframes.
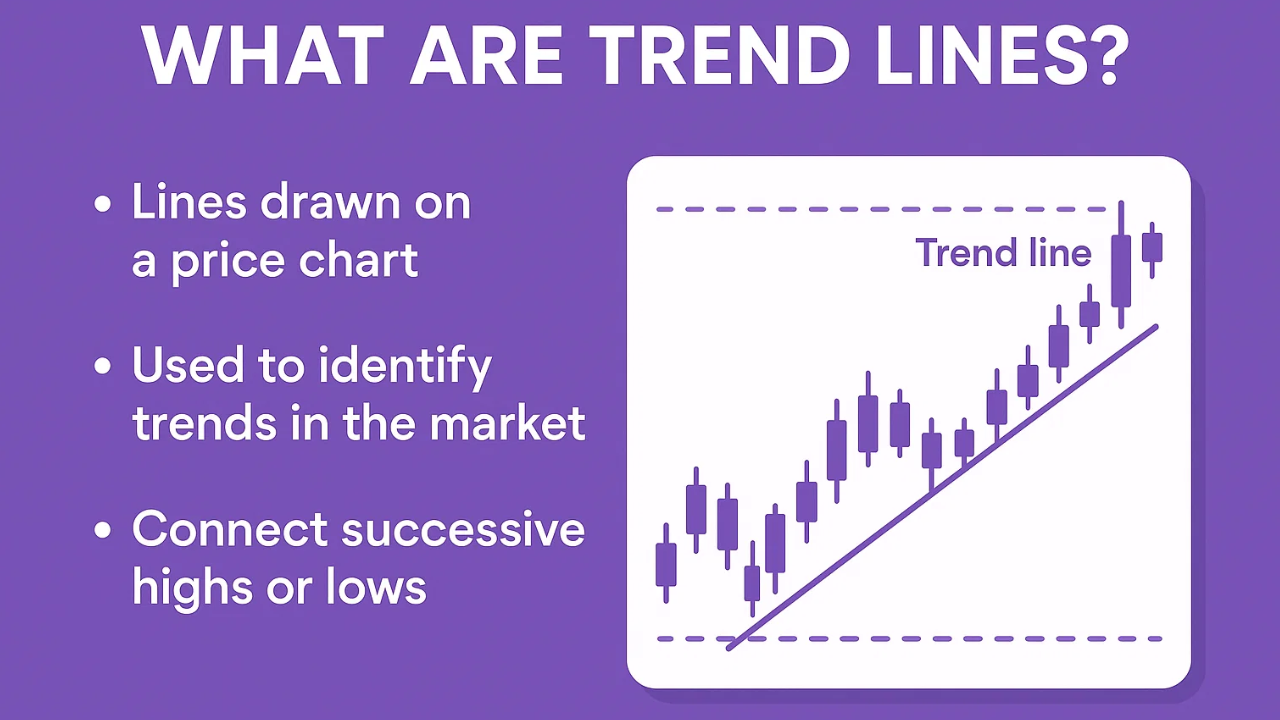
What are Trend Lines in Trading?
A trend line is simply a straight line connecting significant highs or lows on a price chart. However, their power lies in how they function as dynamic support and resistance levels.
Uptrend lines connect higher lows and act as dynamic support
Downtrend lines connect lower highs and act as dynamic resistance
They're "dynamic" because they move over time, unlike horizontal support/resistance
Here's a critical insight from my trading experience: in real markets, you'll rarely find perfect trend lines that exactly connect every low or high. Some lows might dip slightly below the line, while others might not quite reach it. This is why I prefer thinking of trend lines as trend zones rather than precise lines.
When a trend line breaks, it often signals a potential shift in market direction. This makes trend line breaks valuable trading opportunities when combined with other confirmation signals.
"More touches = Better trend line"
"Quality reactions = Reliable trend line"
Watch Out: Higher lows into resistance (ascending triangle) = Breakout strength building, NOT trend line validity!
TradingView's advanced charting tools help you identify quality touches with volume profiles, multi-timeframe analysis, and 100+ technical indicators.
Try Premium Free 30-day trial + $15 bonus on upgradeTo draw a trend line, you need at least two points - either two highs or two lows. Many traders look for a third touch to confirm the trend line's validity. However, here's where conventional wisdom can mislead you.
Many trading educators claim that the more touches a trend line has, the more significant it becomes. From my experience, this isn't always true. I've seen trend lines with four or five touches that turned out to be weak and unreliable.
What matters more is the quality of those touches. Here's what to look for:
Strong reactions at each touch point
Well-spaced swings between touches
Volume confirmation at touch points
Clear price rejection from the trend line
When you see higher lows approaching a resistance line (creating a ascending triangle pattern), this actually shows potential breakout strength, not trend line validity. Even though you're getting more touches, the trend line is actually weakening as buyers gain strength.
Through extensive chart analysis and trading experience, I've identified four key characteristics of strong, reliable trend lines:
Look for trend line touches that produce immediate and decisive moves away from the line. This demonstrates real supply or demand at that level. Weak, hesitant reactions often precede trend line failures.
Strong trend lines often see increased volume at touch points. This volume surge confirms that institutional traders and significant market participants are actively defending these levels. I always keep volume indicators visible when analyzing trend lines.
The best trend lines have geometrically proportioned swings between touches. When touches become clustered or irregular, it often signals the trend is losing its rhythm and may be preparing for a reversal.
Sustainable trends typically have moderate angles - not too steep, not too flat. Parabolic moves with extremely steep trend lines are often unsustainable and prone to violent reversals. These steep trends can be difficult to trade effectively and their trend lines less reliable.
Always evaluate trend lines within the broader context of price action and market structure. A trend line should complement your analysis, not replace it. This is why understanding concepts like support and resistance, price action patterns, and volume analysis enhances your trend line trading significantly.
Recognizing when a trend line is weakening is crucial for two reasons: it helps you exit trades in the trend's direction before reversal, and it identifies potential breakout opportunities. Here are the key warning signs:
Extremely steep trend lines indicate unsustainable momentum. These parabolic moves often end in sharp reversals. When you spot these, prepare for potential trend exhaustion.
Be wary of trend lines that don't have clean touches or require you to "force fit" the line to match the price action. If you're struggling to make a trend line work, it probably isn't valid.
When price starts hugging or clustering around a trend line instead of bouncing cleanly, it signals weakening support or resistance. I've noticed this often forms flag patterns that precede breakouts.
In an uptrend, if price fails to make new highs after touching the trend line, the trend is weakening. This divergence between the trend line and actual price momentum is a powerful warning signal.
When a trend line break occurs with significantly higher volume than recent average, it often confirms a true reversal rather than a false breakout. Volume is your friend in confirming trend line breaks.
Look for powerful price moves with volume confirmation
Connect anchor points and treat lines as zones
⚠️ Warning Signs:
Wait for multiple confirmation signals
Create trend channels by copying your trend line (Ctrl+C, Ctrl+V) and placing it parallel on the opposite side for additional trading opportunities.
Execute your trend line strategy with advanced charting tools, up to 100x leverage, and ultra-low fees. Perfect for catching breakouts on Bitcoin and 300+ crypto pairs.
Start Trading Get up to $30,000 in bonuses for new tradersLet me walk you through a practical example using Bitcoin on the 30-minute timeframe, demonstrating how to apply these concepts in actual trading.
When analyzing a chart, I first look for significant price reactions. In a recent Bitcoin downtrend, I identified two powerful bearish moves with strong volume - perfect anchor points for a downtrend line. The volume spikes confirmed institutional participation at these levels.
After connecting these initial points and extending the line, price returned to test it. However, I noticed two warning signs:
The reactions became progressively weaker
Higher lows started forming into the resistance (bullish divergence)
I typically adjust trend lines to include as many quality touches as possible, treating them as zones rather than precise lines. This adjustment often provides a more accurate representation of market sentiment.
When the trend line eventually broke, several confirmation signals appeared:
A candle with significantly higher volume than previous bars
Multiple candle closes above the trend line
Strong follow-through momentum
For a breakout trade example:
Entry: On the confirmed break of the trend line
Stop Loss: Below the most recent swing low (for long positions)
Target: Using a favorable risk-reward ratio (minimum 1:2)
Here's a quick technique - copy your trend line (Ctrl+C, Ctrl+V in most platforms) and create a parallel line on the opposite side. This creates a trend channel that provides additional trading opportunities at both boundaries.
Trend lines work best when combined with:
Market structure analysis
Price action patterns (especially flags and triangles)
Support and resistance levels
Use trend lines to stay aligned with the dominant market direction. Only consider counter-trend trades when you see multiple confirmation signals of trend exhaustion.
Always use stop losses when trading trend line bounces or breaks. The beauty of trend line trading is that it provides clear invalidation points for your trades.
Start with higher timeframes (daily, 4-hour) to identify major trends, then drill down to lower timeframes for precise entries. This multi-timeframe approach improves your success rate significantly.
Don't clutter your charts with dozens of trend lines. Focus on the most significant, well-tested lines that clearly influence price action. Remember, technical analysis should clarify, not complicate your trading decisions.
While traditional wisdom suggests at least three touches confirm a trend line, quality matters more than quantity. Two strong touches with significant price reactions and volume confirmation can create a more reliable trend line than four weak touches. Focus on the strength of reactions, volume at touch points, and how well-spaced the swings are between touches.
There's no rigid rule - it depends on market context. Generally, connecting wicks can capture extreme price levels, while using bodies shows where price actually closed. Many experienced traders use a combination, treating trend lines as zones rather than precise levels. The key is consistency in your approach and recognizing that price rarely respects exact lines in real markets.
Trend lines work across all timeframes due to their fractal nature. For swing trading, daily and 4-hour charts provide reliable trend lines. Day traders often use 1-hour and 15-minute charts. The best approach is using multiple timeframes - identify major trends on higher timeframes, then use lower timeframes for precise entries. Remember, trend lines on higher timeframes typically carry more significance.
Look for confirmation signals: strong volume on the break, multiple candle closes beyond the trend line, and follow-through momentum. False breakouts often lack volume, quickly reverse back inside the trend line, and occur without other supporting technical signals. Using a close beyond the trend line (rather than just a wick) as your trigger can help filter false breaks.
Absolutely. Trend lines on shorter timeframes (5-minute, 15-minute) can provide excellent scalping opportunities. The key is ensuring your trend lines have quality touches even on these lower timeframes. Combine trend line bounces with other indicators like volume or momentum oscillators for higher probability scalping setups. Just remember that trend lines on very short timeframes may be less reliable than those on higher timeframes.
A trend line is a single line connecting highs or lows, while a trend channel consists of two parallel lines - one connecting highs and another connecting lows. Trend channels provide additional trading opportunities as price often oscillates between the upper and lower boundaries. You can easily create a channel by copying your trend line and placing it parallel on the opposite side of price action.
Mastering trend line trading is about much more than simply connecting dots on a chart. It requires understanding market dynamics, recognizing quality over quantity in trend line touches, and integrating multiple forms of analysis for confirmation.
The key takeaways from this guide:
Focus on the quality of trend line touches rather than quantity
Treat trend lines as zones rather than precise levels
Watch for warning signs of trend line failure
Combine trend line analysis with volume and price action
Always manage risk with appropriate stop losses
Remember, trend lines are tools to enhance your market understanding, not magic formulas for guaranteed profits. By applying these concepts with discipline and proper risk management, you can potentially improve your trading results over time.
Continue developing your technical analysis skills by studying market structure and price action patterns. The more tools in your trading toolkit, the better equipped you'll be to navigate any market condition.
Disclaimer: This content is for educational purposes only and should not be considered financial advice. Trading involves substantial risk of loss. Always conduct your own research and consider your financial situation before making any trading decisions.
Discover how to identify and trade key price levels across all markets, including dynamic support and resistance concepts.
Learn the foundations of market structure analysis and how it integrates with trend line trading strategies.
Master how to identify key market turning points that often occur at trend line breaks and reversals.
Learn how to apply multi-timeframe analysis with trend lines across different markets for better trade entries.
Trading & Investing Enthusiast
Teaching traders to understand market psychology, technical analysis, and investing through clear beginner-friendly insights.
Started investing at 16 and became fascinated by how market psychology influences price movements. Still learning something new every day.
Love sharing what I've learned along the way. There's nothing quite like helping someone understand a concept that once confused me too.
Proud to have built a community where traders actively share insights and grow together through daily market analysis and discussion.
Want to join our learning journey?
Professional tools to identify quality touches & trade breakouts with confidence