
Linda Raschke Trading Strategy: MACD Indicator Settings
Discover how MACD uses moving averages to generate powerful trading signals for stocks, forex, and crypto.
Last Updated: December 11, 2025
Do you like videos over reading? In this youtube video you will learn some of the best moving averages indicators in tradingview, we will cover the Simple Moving Average (SMA), Exponential Moving Average (EMA), Weighted Moving Average (WMA), Hull Moving Average, and ALMA - plus the exact settings for each, when to use them for scalping vs swing trading, and how to avoid common mistakes that cost traders money.
The type of moving average you choose matters significantly - SMA for stable long-term trends, EMA for responsive short-term trading, and advanced MAs like Hull for ultra-fast scalping
Simple Moving Averages (50 and 200-day) are best for identifying major trends on daily charts, while Exponential Moving Averages excel in momentum trading and short-term strategies
The Hull Moving Average combines minimal lag with exceptional smoothness, making it ideal for crypto and forex scalping on 1-5 minute timeframes
All moving averages perform poorly in choppy, sideways markets - always assess market conditions and ensure adequate liquidity before applying MA strategies
The ALMA (Arnaud Legoux Moving Average) offers unique customization through offset and sigma parameters, providing traders with fine-tuned control over smoothness and responsiveness
Have you ever wondered why three moving averages based on the same 100 periods can look completely different on your trading chart? The type of moving average you choose can dramatically impact your trading results, and in this comprehensive guide, I'll reveal the best moving average indicator settings that professional traders use on TradingView.
Whether you're scalping crypto on the 1-minute chart or swing trading stocks on the daily timeframe, understanding which moving average to use—and when—can be the difference between consistent profits and frustrating losses. In this guide, we'll explore everything from the simple moving average (SMA) to advanced indicators like the Hull Moving Average and ALMA, giving you the exact settings and strategies to potentially improve your trading performance.
This content is for educational purposes only and should not be considered financial advice. Always conduct your own research and consider consulting with a financial advisor before making investment decisions.

Moving averages are fundamental technical indicators that smooth out price data to reveal trends more clearly. Think of them as a way to filter out the market noise and see the bigger picture. By calculating the average price over a specific period, moving averages help traders identify the overall direction of the market.
But here's what many beginners don't realize: different types of moving averages react at vastly different speeds to price changes. Some provide lightning-fast signals perfect for day trading, while others offer stable, reliable trend confirmation for longer-term positions. The key is matching the right moving average to your trading style and market conditions.
High lag = Late signals
Test SMA strategies on
📈 TradingView Free 30-day trial availableThe Simple Moving Average gives equal weight to all prices in its calculation period. If you're using a 100-day SMA, it simply averages the closing prices of the last 100 days. This equal weighting creates a smooth, stable line that many institutional traders watch closely.
Long-term investing: 200-day SMA on daily charts
Swing trading: 50-day SMA on daily charts
Position trading: 100-day SMA on 4-hour charts
From my analysis of the transcript, the SMA excels in these specific scenarios:
Identifying major trend changes on higher timeframes - The 200-day SMA is particularly watched by institutional investors
Finding dynamic support and resistance levels - Though as mentioned in the video, this isn't always the most reliable approach
Confirming long-term market direction - Perfect for investors who want to stay on the right side of the major trend
The biggest drawback? Lag. The SMA reacts slowly to price changes, which means you might miss the early stages of a new trend. It's like driving while only looking in the rearview mirror—you see where you've been clearly, but not necessarily where you're going.
Always verify liquidity on lower timeframes!
Perfect your EMA timing with
📈 TradingView Premium $15 bonus on upgradeThe Exponential Moving Average gives more weight to recent prices, making it much more responsive than the SMA. This faster reaction time is exactly why it's become the go-to indicator for short-term traders, especially in volatile markets like crypto and forex.
Crypto scalping: 9 EMA on 1-minute charts
Forex day trading: 21 EMA on 15-minute charts
Stock swing trading: 20 EMA on hourly charts
As highlighted in the video, the EMA is particularly powerful for momentum strategies. When price strongly breaks above or below the EMA with volume, it often signals the start of a powerful move. This makes it invaluable for traders looking to catch trends early.
Always check liquidity first - The video emphasizes this crucial point. On lower timeframes, you need sufficient volume to avoid false signals
Combine with other indicators - The EMA works best when confirmed by volume or momentum oscillators
Be aware of choppy markets - The EMA's sensitivity becomes a weakness during consolidation periods
Best For: 10 WMA on 5-min charts
Similar to: EMA performance
Pro Insight: WMA offers linear weighting vs EMA's exponential - subtle but can make a difference in volatile markets!
TradingView lets you overlay multiple moving averages instantly
Try Premium 30 days freeWhile similar to the EMA, the WMA uses a different calculation method that some traders prefer. It assigns linearly decreasing weights to older prices, creating a balance between responsiveness and smoothness.
Best WMA Setting: 10-period WMA on 5-minute charts for intraday trading
Fastest trend detection of all MAs
Minimal noise, maximum clarity
Perfect for volatile markets
Caution: Performs poorly in sideways markets - always check trend first!
Get instant alerts when HMA signals appear
This is where things get exciting. The Hull Moving Average combines multiple weighted moving averages to achieve something remarkable: minimal lag with exceptional smoothness.
Lightning-fast trend detection - Reacts to trend changes faster than any traditional MA
Incredibly smooth - Filters out noise better than faster MAs like the EMA
Perfect for scalping - Especially effective in crypto and forex markets
Recommended HMA Settings:
Scalping: 21 HMA on 1-minute charts
Day trading: 55 HMA on 15-minute charts
Gaussian smoothing filters fake moves
Fine-tune ALMA settings with
📈 TradingView Tools Advanced charting featuresThe ALMA uses Gaussian distribution to create a uniquely smooth and responsive indicator. What sets it apart is its customizability through offset and sigma parameters.
Trend confirmation - Excellent for validating breakouts
Mean reversion trading - The smooth nature makes it ideal for identifying oversold/overbought conditions
Support and resistance - More reliable than traditional MAs for dynamic levels
Compare all 5 moving averages at a glance to find the perfect fit for your trading style
For Long-Term Investors:
Primary: 200-day SMA
Secondary: 50-day SMA
Focus on daily and weekly charts
For Swing Traders:
Primary: 20 or 50 EMA
Secondary: 100 SMA for major trend
Use 4-hour and daily charts
For Day Traders:
Primary: 9 or 21 EMA
Alternative: 21 HMA for cleaner signals
Focus on 5-minute to 1-hour charts
For Scalpers:
Primary: Hull Moving Average (9-21 period)
Alternative: ALMA with custom settings
Use 1-minute to 5-minute charts
Access the Indicators Menu: Click on the indicators tab at the top of your chart
Search Efficiently: Type "moving average" followed by the specific type (simple, exponential, hull, etc.)
Customize Your Settings:
Click the settings icon (gear symbol)
Adjust the length/period
Modify colors and line thickness for clarity
Save as a template for quick access
Create indicator templates for different trading strategies
Use the "Compare" function to overlay multiple MAs
Set up alerts when price crosses your key moving averages
Utilize TradingView's backtesting features to optimize your settings
Note: You can get a 30-day free trial of TradingView Premium plus a $15 bonus through the special link mentioned in the video description.
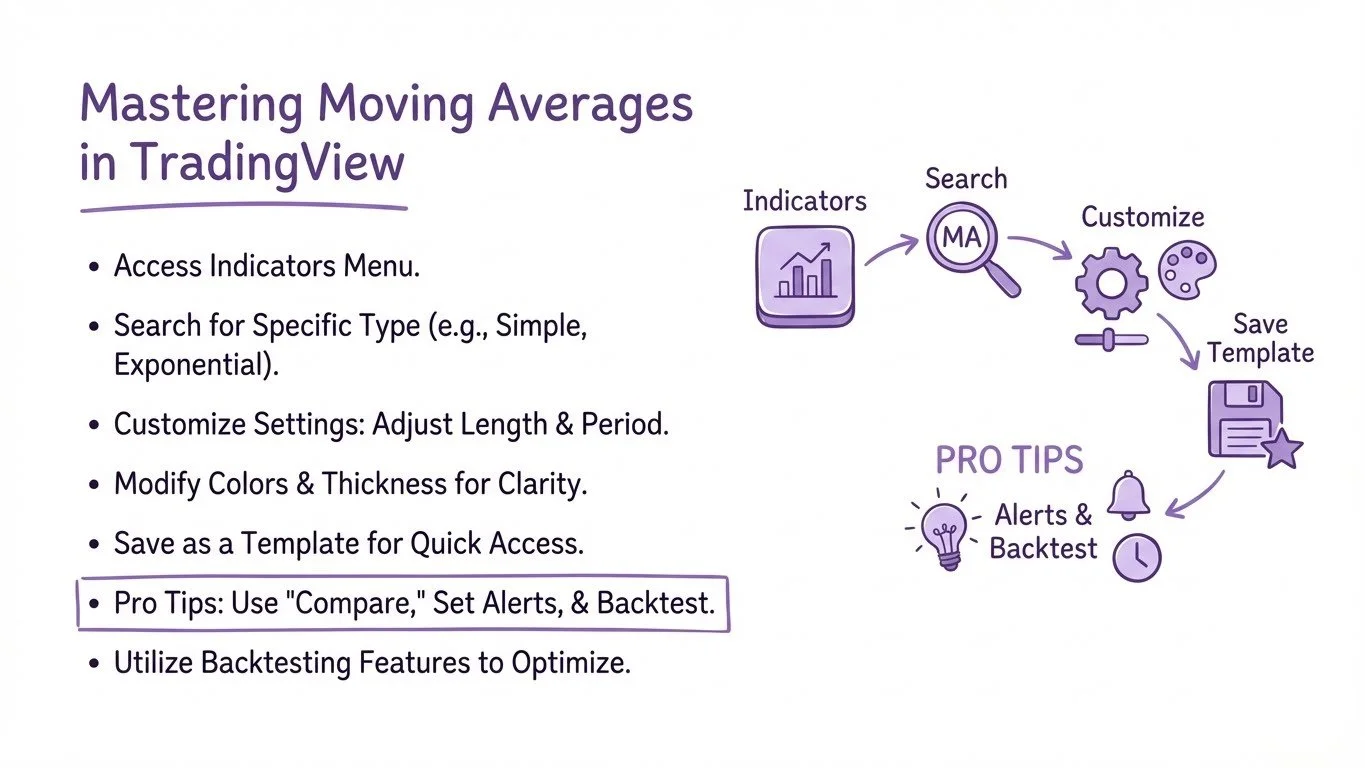
How to Set Up Moving Average on TradingView
As emphasized in the video, moving averages perform poorly during consolidation. Always assess market conditions first.
Don't focus solely on one timeframe. A bullish signal on the 5-minute chart means little if the daily trend is strongly bearish.
Constantly changing your MA periods to fit recent price action leads to curve-fitting and poor real-world results.
Moving average signals are much more reliable when accompanied by above-average volume.
Professional traders often use different moving averages across multiple timeframes:
Higher timeframe: Determine overall bias (200 SMA on daily)
Trading timeframe: Find entry signals (21 EMA on hourly)
Lower timeframe: Fine-tune entries (9 HMA on 15-minute)
Adjust your position size based on the distance from key moving averages:
Close to MA: Larger position with tight stop
Far from MA: Smaller position with wider stop
Create bands around your chosen MA (typically 1-3% above and below) to identify overbought/oversold conditions and potential reversal zones.
For beginners, the 50-day Simple Moving Average (SMA) on daily charts is an excellent starting point. It's widely watched by institutional traders, provides clear trend identification, and has less noise than faster moving averages. Once comfortable, beginners can explore the 20-day Exponential Moving Average (EMA) for more responsive signals.
Absolutely! Many professional traders use multiple moving averages simultaneously. A popular combination is the 20, 50, and 200-period moving averages. This allows you to see short, medium, and long-term trends at once. The key is not to overcrowd your chart - typically 2-3 moving averages provide the best balance of information without confusion.
Moving averages are trend-following indicators, designed to work best in trending markets. During sideways or choppy conditions, prices constantly cross above and below the moving average, creating numerous false signals. This is why it's crucial to first identify market conditions before applying moving average strategies. Consider using range-bound indicators like RSI or Bollinger Bands during consolidation periods.
Period and length are essentially the same thing - they both refer to the number of data points (candles) used in the calculation. A 50-period moving average on a daily chart uses the last 50 days of data, while on a 1-hour chart, it uses the last 50 hours. The terminology varies between platforms, but the concept remains identical.
Most traders use closing prices (the default setting) because they represent the final consensus of value for that period. However, some strategies benefit from using other price types: High/Low average for volatility analysis, or Typical Price (HLC/3) for a more balanced view. Experiment with different settings, but always backtest before implementing in live trading.
Use the Hull Moving Average when you need minimal lag and are trading fast-moving markets like crypto or forex on lower timeframes (1-15 minutes). It's ideal for scalping and quick entries/exits. Stick with traditional MAs (SMA/EMA) for higher timeframes, position trading, or when you need more stable, reliable signals that filter out minor price fluctuations.
Choosing the right moving average indicator can significantly impact your trading success. While the Simple Moving Average provides reliable long-term trend identification, the Exponential Moving Average offers the responsiveness needed for short-term trading. Advanced indicators like the Hull Moving Average and ALMA open up new possibilities for traders seeking minimal lag and maximum smoothness.
Remember, the best moving average isn't necessarily the most complex one—it's the one that aligns with your trading style, timeframe, and market conditions. Start with the basics, master one type at a time, and gradually incorporate more advanced indicators as your skills develop.
The key to success with moving averages lies not in finding the "perfect" indicator, but in understanding how each one behaves in different market conditions and using them as part of a comprehensive trading strategy. Combined with proper risk management and continuous learning, these powerful tools can help you navigate the markets with greater confidence and precision.
Disclaimer: This article is for educational purposes only and does not constitute financial advice. Trading involves substantial risk of loss. Always conduct thorough research and consider seeking advice from qualified financial professionals before making investment decisions.
Open TradingView and start experimenting with the settings discussed in this guide.
Always practice with a demo account before risking real capital.
Discover how MACD uses moving averages to generate powerful trading signals for stocks, forex, and crypto.
Learn how to combine RSI with moving averages for confirmed entry and exit signals in your trading.
Combine Fibonacci retracements with moving averages to identify high-probability trading zones.
Master Bollinger Bands, which use a 20-period moving average as their foundation for volatility analysis.
Trading & Investing Enthusiast
Teaching traders to understand market psychology, technical analysis, and investing through clear beginner-friendly insights.
Started investing at 16 and became fascinated by how market psychology influences price movements. Still learning something new every day.
Love sharing what I've learned along the way. There's nothing quite like helping someone understand a concept that once confused me too.
Proud to have built a community where traders actively share insights and grow together through daily market analysis and discussion.
Want to join our learning journey?
Compare SMA, EMA, WMA, Hull & ALMA side-by-side on real charts