
Top Down Analysis in Forex, Crypto and Stock Trading
Master the complete top-down analysis approach, which is essentially multi timeframe analysis applied systematically across all major markets.
Last Updated: December 11, 2025
Are you a visual learner? No problem, watch this YouTube video where you will learn what multi timeframe analysis is, how it works and see a complete step-by-step trading strategy in action with real Bitcoin examples (including why some trades fail and others succeed).
Multi timeframe analysis involves analyzing the same market across different time periods to see both the big picture trend and short-term price movements simultaneously.
The systematic Trend → Setup → Entry method uses higher timeframes for trend identification, medium timeframes for pattern recognition, and lower timeframes for precise execution.
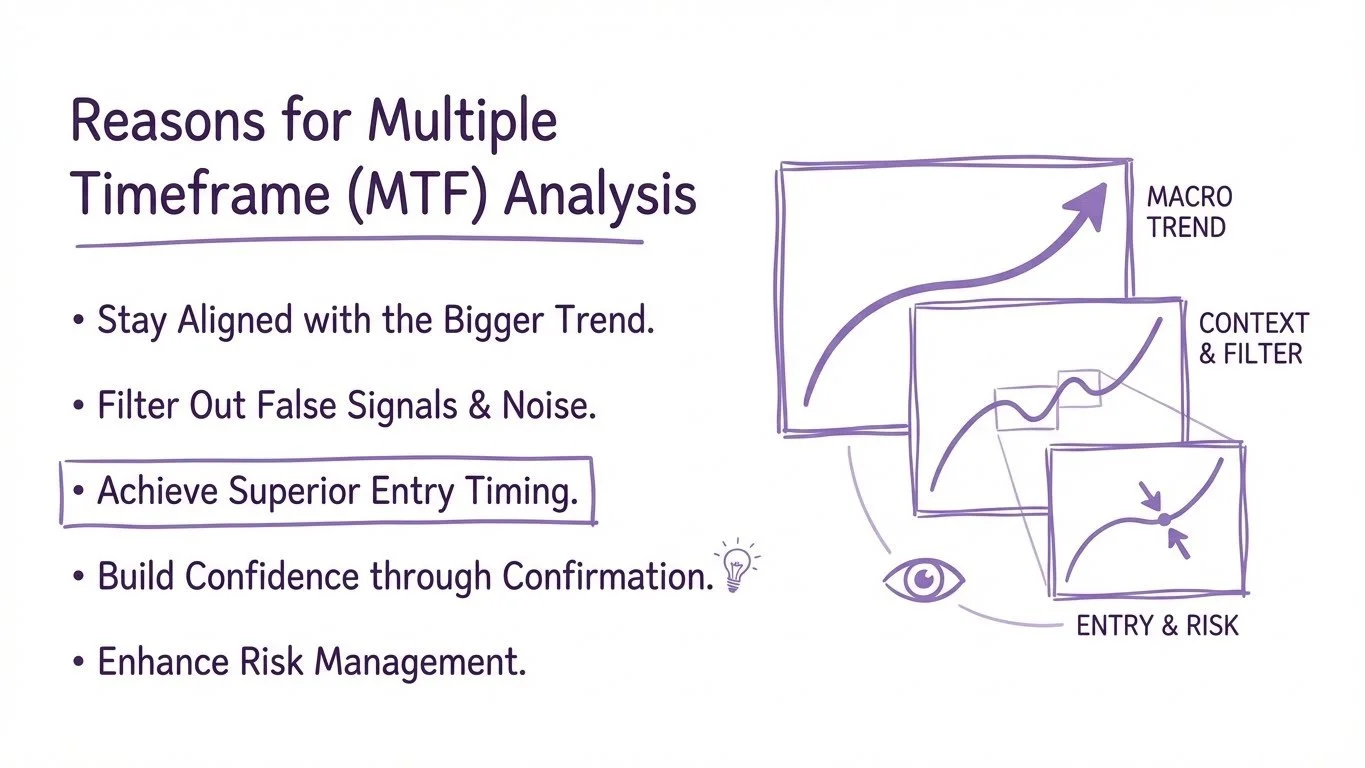
Professional traders use MTF analysis to stay aligned with trends, filter false signals, improve entry timing, build confidence, and enhance risk management.
Common effective timeframe combinations include 15M/1H/4H for day trading and 1H/4H/Daily for swing trading, with a preference for 4:1 or 5:1 ratios between timeframes.
Volume confirmation is critical for validating signals across timeframes - not all setups work, and proper risk management must account for market volatility beyond just technical levels.
Multi timeframe analysis (MTF) stands as one of the most powerful yet misunderstood concepts in trading. When executed correctly, this analytical approach can significantly improve your trading results by providing a comprehensive view of market dynamics. However, when misapplied, it can lead to confusion and substantial losses.
In this comprehensive guide, we'll explore everything you need to know about multi timeframe trading, from the fundamental concepts to advanced strategies that professional traders use to gain their edge in the markets.

What is Multi Time Frame Analysis in Trading?
Multi timeframe analysis, often abbreviated as MTF, involves analyzing the same financial instrument across different time periods simultaneously. Rather than focusing on a single timeframe, traders examine multiple charts ranging from longer-term perspectives down to shorter-term execution timeframes.
The core principle behind MTF analysis is elegantly simple: you're both zooming in and zooming out to capture the complete market picture. For instance, a day trader might analyze the 4-hour chart for overall trend direction, the 1-hour chart for setup identification, and the 15-minute chart for precise entry timing.
This approach differs fundamentally from single-timeframe trading because it provides context. A bullish signal on a 15-minute chart carries much more weight when it aligns with an upward trend on the daily chart, compared to when it appears during a major downtrend on higher timeframes.
The beauty of multi timeframe analysis lies in its systematic approach:
Higher timeframes (daily, weekly) reveal the overall trend and major support/resistance levels
Medium timeframes (4-hour, 1-hour) help identify specific trading setups and patterns
Lower timeframes (15-minute, 5-minute) provide precise entry and exit signals
This hierarchical structure ensures that you're not fighting against the prevailing market direction while still capturing short-term opportunities.
How the three-tier system works together
Understanding why MTF analysis is so effective can help you appreciate its value and implement it more successfully in your own trading.
Reasons for Multi Time Frame Analysis in Trading
Trading with the trend remains one of the most reliable strategies across all markets and timeframes. Multi timeframe analysis excels at identifying the dominant trend direction, which significantly improves your win rate.
Consider this scenario: You spot what appears to be a bullish breakout on a 15-minute chart. Without checking higher timeframes, you might enter a long position, only to discover that the daily chart shows a strong downtrend with your "breakout" occurring at a major resistance level. MTF analysis prevents such costly mistakes.
Lower timeframes are notorious for generating false signals due to market noise. Higher timeframes act as a filter, helping you distinguish between genuine opportunities and market manipulation.
When multiple timeframes align to support a trade setup, the probability of success increases dramatically. This confluence approach reduces the number of trades you take, but significantly improves their quality.
While higher timeframes provide direction, lower timeframes excel at execution. This combination allows you to enter trades at optimal prices rather than chasing momentum after significant moves have already occurred.
Professional traders often identify opportunities on higher timeframes but wait for specific confirmation signals on lower timeframes before executing their trades.
Confidence is crucial for trading success, and MTF analysis builds confidence through confirmation. When you see multiple timeframes supporting your analysis, you're more likely to stick with your trading plan and avoid premature exits.
This psychological benefit cannot be overstated. Many traders struggle with doubt and second-guessing, but MTF analysis provides the confirmation needed to execute trades with conviction.
Multi timeframe analysis provides clearer context for placing stop losses and profit targets. You can identify logical levels on higher timeframes while using lower timeframes to fine-tune your risk management.
For example, you might identify a major support level on the daily chart for your stop loss placement, while using the 1-hour chart to determine the exact entry point that maximizes your risk-to-reward ratio.
Selecting the right timeframe combination depends on your trading style, available time, and market conditions. Here are the most effective combinations used by professional traders:
Option 1: The Classic Triple (15M/1H/4H)
4-hour: Overall trend and key levels
1-hour: Setup identification
15-minute: Entry and exit timing
Option 2: The Scalper's Choice (5M/15M/1H)
1-hour: Trend direction
15-minute: Pattern recognition
5-minute: Precise execution
Many successful day traders actually prefer using only two timeframes to avoid analysis paralysis. The 15-minute and 1-hour combination provides an excellent balance between context and execution precision.
Standard Swing Setup (1H/4H/Daily)
Daily: Major trend identification
4-hour: Setup development
1-hour: Entry confirmation
Extended Swing Approach (4H/Daily/Weekly)
Weekly: Long-term market direction
Daily: Intermediate trend analysis
4-hour: Trade execution
One particularly interesting approach involves combining the weekly, daily, and 1-hour timeframes. While this creates an uneven step ratio (7x from weekly to daily, then 24x from daily to 1-hour), it offers unique advantages:
Weekly timeframe: Captures major market cycles and long-term trends
Daily timeframe: Identifies intermediate-term patterns and key levels
1-hour timeframe: Provides precise entry opportunities
This combination works especially well for traders who want to capture significant moves while maintaining flexibility in their entry timing.
The most effective approach to multi timeframe analysis follows a systematic three-step process that professional traders have refined over decades of market experience.
Your analysis always begins with the highest timeframe in your combination. This timeframe serves as your market compass, showing you the direction of least resistance.
Market structure analysis provides the most reliable method for trend identification. Look for:
Consecutive higher highs and higher lows (uptrend)
Consecutive lower highs and lower lows (downtrend)
Sideways movement with equal highs and lows (ranging market)
If you're not comfortable with market structure analysis, a simple 50-period moving average can serve as a trend filter. Price above the moving average suggests an uptrend, while price below indicates a downtrend.
Once you've identified the trend direction, move to your medium timeframe to identify specific trading opportunities. This is where you look for:
Chart patterns (triangles, flags, head and shoulders)
Support and resistance tests
Pullbacks in trending markets
Breakout opportunities
The key is finding setups that align with your higher timeframe trend analysis. If the weekly chart shows an uptrend, focus on bullish setups on your daily chart.
Your lowest timeframe provides the trigger for trade execution. Look for:
Candlestick patterns (engulfing, hammer, doji reversal)
Momentum confirmation (volume spikes, strong breakout candles)
Price action signals (false breakout, double bottom/top)
Never enter a trade based solely on lower timeframe signals. Always ensure your entry aligns with both higher and medium timeframe analysis.
Let's examine a complete trading strategy that demonstrates MTF analysis in action. This approach, known as the "Trend and Pullback Strategy," has proven effective across various markets and conditions.
Trade pullbacks in trending markets across multiple timeframes
Use TradingView's multi-chart layouts to master the trend & pullback method
📊 Start Trading 30-day free trial + $15 bonus • Multi-chart layouts includedObjective: Identify trending markets on higher timeframes, wait for pullbacks on medium timeframes, then use lower timeframes for precise entry timing.
Timeframe Combination: Weekly/Daily/1-Hour (for swing trading) or 4-Hour/1-Hour/15-Minute (for day trading)
Market Suitability: Works best in trending markets with clear directional bias
Phase 1: Trend Identification (Higher Timeframe)
Begin your analysis on the weekly chart (or 4-hour for day trading). Use market structure to identify the trend:
Mark recent swing highs and lows
Determine if the pattern shows higher highs/higher lows (uptrend) or lower highs/lower lows (downtrend)
Identify key support and resistance levels
Confirm trend direction with a 50-period moving average if needed
Phase 2: Setup Recognition (Medium Timeframe)
Move to the daily chart (or 1-hour for day trading) to identify pullback opportunities:
Look for impulsive moves in the trend direction followed by corrective pullbacks
Identify common pullback patterns:
Bull flags (uptrend pullbacks)
Bear flags (downtrend pullbacks)
Symmetrical triangles
Rectangle consolidations
Wait for the pullback to reach a logical support level (uptrend) or resistance level (downtrend)
Phase 3: Entry Execution (Lower Timeframe)
Switch to the 1-hour chart (or 15-minute for day trading) for entry confirmation:
Wait for price action signals that suggest the pullback is ending
Look for volume confirmation on breakout attempts
Identify specific candlestick patterns that support your directional bias
Set stop losses below the recent swing low (uptrend) or above the recent swing high (downtrend)
Target previous highs (uptrend) or previous lows (downtrend) for profit taking
TradingView provides excellent tools for multi timeframe analysis, but many traders don't know how to optimize their setup for maximum efficiency.
Access Layout Options: Click on "Layout Setup" in the top toolbar
Choose Your Configuration: Select from 1-16 chart layouts (3-4 charts optimal for most traders)
Arrangement Preference: Choose between horizontal or vertical arrangements based on your screen size and preference
Pro Tip: Vertical arrangements often work better for trend analysis as they mimic the natural flow of market movement.
Chart 1 (Highest Timeframe):
Add a 50-period moving average for trend confirmation
Mark major support and resistance levels
Keep the chart clean with minimal indicators
Chart 2 (Medium Timeframe):
Focus on pattern recognition
Add volume indicators for confirmation
Include Fibonacci retracement tools for pullback analysis
Chart 3 (Lowest Timeframe):
Emphasize price action and candlestick patterns
Include volume for breakout confirmation
Add short-term support and resistance levels
Sync Charts: Ensure all charts move together when you change symbols
Alert System: Set alerts on higher timeframes for setup notifications
Drawing Tool Sync: Copy trend lines and levels across all timeframes
Custom Indicators: Use multi-timeframe indicators that display higher timeframe data on lower timeframe charts
Let's examine a real Bitcoin trade example that demonstrates both the power and the pitfalls of multi timeframe analysis.
Weekly Analysis (Trend Identification): Bitcoin showed a clear uptrend on the weekly chart with consecutive higher highs and higher lows. The 50-period moving average provided additional confirmation, with price consistently trading above this level.
Daily Analysis (Pattern Recognition): The daily chart revealed a symmetrical triangle pattern following an impulsive move higher. This type of continuation pattern typically suggests the trend will resume in the direction of the prior move.
1-Hour Analysis (Entry Timing): The 1-hour chart showed the triangle pattern in greater detail, with clear upper and lower boundaries converging toward an apex.
The initial breakout appeared promising with a momentum candle breaking above the triangle's upper boundary. However, this trade ultimately failed for several critical reasons:
Insufficient Volume: While there was a slight volume increase, it wasn't substantial enough to confirm genuine institutional participation
Weak Follow-Through: The breakout candle wasn't followed by additional momentum in the same direction
Poor Risk Management: The stop loss was placed too close to the entry, making the trade susceptible to normal market volatility
After the failed breakout, price continued to decline and formed a double bottom pattern at a key support level. This second opportunity proved much more successful due to:
Massive Volume Confirmation: The volume spike during the double bottom formation indicated strong buying interest
Clear Price Action Signal: A bullish engulfing pattern formed at the double bottom, providing clear directional confirmation
Confluence of Factors: The support level held, volume confirmed the reversal, and price action provided the signal
This example illustrates several crucial principles:
Not all setups work, even when they appear textbook perfect
Volume confirmation is critical for validating breakouts and reversals
Patience pays off - waiting for the right setup often beats forcing trades
Risk management must account for market volatility, not just technical levels
The best MTF traders use technology to eliminate manual work and focus on high-probability setups.
Access all advanced MTF tools in one professional platform
One of the biggest challenges with multi timeframe analysis is the tendency to over-analyze. Here's how to maintain focus:
Start with two timeframes and add a third only when you're comfortable
Define clear rules for each timeframe's role in your analysis
Set time limits for your analysis to prevent endless chart staring
Use checklists to ensure you cover all necessary elements without getting sidetracked
Different timeframes won't always align perfectly. When conflicts arise:
Give priority to higher timeframes for overall direction
Wait for alignment rather than forcing trades during conflicts
Consider market context - news events can create temporary timeframe conflicts
Reduce position size when timeframes show mixed signals
Understanding how timeframes relate to each other helps improve your analysis:
4:1 Ratio Rule: Many traders prefer timeframes with a 4:1 or 5:1 ratio (e.g., 1-hour and 15-minute)
Fibonacci Relationships: Some timeframes naturally align with Fibonacci ratios
Market Session Alignment: Consider how timeframes align with major trading sessions
Modern trading platforms offer sophisticated MTF tools:
Multi-timeframe indicators that display higher timeframe data on lower timeframe charts
Automated alert systems that notify you when setups align across timeframes
Synchronized chart layouts that automatically adjust when you change symbols
Cloud-based analysis that allows you to access your MTF setups from anywhere
These mistakes cost traders thousands. Master the basics before adding complexity.
Get exclusive MTF courses, trading tools & priority support
Many traders believe that using more timeframes automatically improves results. In reality, adding too many timeframes often leads to:
Analysis paralysis - spending too much time analyzing and missing opportunities
Conflicting signals - different timeframes showing contradictory information
Reduced conviction - uncertainty caused by too much information
Solution: Start with two timeframes and only add a third when you've mastered the first two.
Some traders become so focused on lower timeframe entries that they ignore the bigger picture. This leads to:
Trading against the trend - taking countertrend trades that face strong resistance
Poor risk-reward ratios - entering trades that have limited upside potential
Increased stress - fighting against the market's natural direction
Solution: Always begin your analysis with the highest timeframe and never trade against the primary trend without compelling reasons.
Switching between different timeframe combinations based on market conditions or recent results often leads to:
Lack of expertise - never becoming truly proficient with any one approach
Emotional decision-making - changing systems based on recent losses or wins
Reduced confidence - uncertainty about which approach to use
Solution: Choose one or two timeframe combinations and stick with them long enough to develop genuine expertise.
Price movement without volume confirmation often leads to false signals. Common volume-related mistakes include:
Ignoring volume on breakouts - failing to confirm momentum with volume spikes
Missing volume divergences - not noticing when price and volume trends diverge
Overlooking volume patterns - failing to recognize volume accumulation or distribution
Solution: Always include volume analysis in your MTF approach, especially for confirmation signals.
Some traders analyze multiple timeframes effectively but fail to integrate this analysis into their risk management. This results in:
Inappropriate position sizing - not adjusting size based on timeframe analysis
Poor stop loss placement - placing stops based on single timeframes rather than MTF analysis
Inadequate profit targets - not using multiple timeframes to identify logical exit points
Solution: Use your MTF analysis to inform all aspects of trade management, not just entry timing.
Multi timeframe analysis provides psychological benefits that extend beyond technical advantages. When multiple timeframes align to support a trade idea, it creates:
Increased Conviction: Traders feel more confident in their decisions when they have confirmation from multiple perspectives.
Reduced Second-Guessing: The comprehensive analysis reduces the tendency to exit trades prematurely due to minor price fluctuations.
Better Stress Management: Understanding the bigger picture helps traders remain calm during temporary adverse movements.
While MTF analysis provides valuable insights, it can also create information overload. Successful traders manage this by:
Developing Systematic Approaches: Creating checklists and procedures that streamline the analysis process.
Practicing Selective Attention: Learning to focus on the most relevant information while filtering out noise.
Building Pattern Recognition: Developing the ability to quickly identify key patterns across multiple timeframes.
MTF analysis often requires waiting for alignment across multiple timeframes, which demands:
Enhanced Patience: Understanding that the best opportunities require time to develop.
Disciplined Execution: Resisting the urge to force trades when timeframes don't align.
Long-term Perspective: Focusing on overall trading performance rather than individual trade outcomes.
For day trading, the most effective combinations are 15-minute/1-hour/4-hour or 5-minute/15-minute/1-hour. The 15M/1H/4H combination provides excellent balance between trend context and execution precision, while the 5M/15M/1H setup works well for more active scalping strategies. Many successful day traders actually prefer using just two timeframes to avoid analysis paralysis.
Start with only two timeframes and gradually add a third as you become comfortable. Define clear rules for what each timeframe should tell you (trend, setup, entry), set time limits for your analysis, and use checklists to stay focused. Remember that more timeframes don't automatically mean better results - simplicity often leads to more consistent trading.
When timeframes conflict, give priority to higher timeframes for overall direction and wait for alignment rather than forcing trades. You can also reduce position size when signals are mixed, or consider that news events might be creating temporary conflicts. The key is patience - the best trades occur when multiple timeframes align.
Volume analysis is crucial for confirming signals across all timeframes. Look for volume spikes during breakouts, volume confirmation on reversals, and volume patterns that support your directional bias. The Bitcoin trade example in our guide showed how massive volume at the double bottom provided much better confirmation than the earlier breakout with weak volume.
Absolutely! Swing trading actually benefits greatly from MTF analysis. Use combinations like 1-hour/4-hour/daily or 4-hour/daily/weekly. The higher timeframes help identify major trends and key levels, while lower timeframes provide precise entry opportunities. This approach allows you to capture larger moves while maintaining good risk management.
While MTF analysis is more complex than single timeframe trading, beginners can start with a simple two-timeframe approach. Begin with a higher timeframe for trend direction and a lower timeframe for entries. Focus on basic concepts like trend identification and support/resistance before advancing to three-timeframe systems. The key is consistent practice and gradual skill development.
Multi timeframe analysis represents one of the most powerful tools available to traders, but like all powerful tools, it requires skill and practice to use effectively. The key to success lies not in complexity, but in developing a systematic approach that you can execute consistently.
Remember these fundamental principles as you develop your MTF trading skills:
Start Simple: Begin with two timeframes and gradually add complexity as your skills develop.
Maintain Consistency: Stick with proven timeframe combinations rather than constantly switching approaches.
Prioritize Higher Timeframes: Always give precedence to longer-term trends and structures.
Integrate Volume: Use volume analysis to confirm signals across all timeframes.
Practice Risk Management: Use your MTF analysis to inform position sizing, stop losses, and profit targets.
Stay Patient: Wait for proper alignment rather than forcing trades when timeframes conflict.
The journey to mastering multi timeframe analysis takes time and dedication, but the rewards justify the effort. As you develop proficiency in this approach, you'll find that your trading decisions become more informed, your risk management improves, and your overall consistency increases.
Whether you're a day trader looking for precise entries or a swing trader seeking to capture larger moves, multi timeframe analysis provides the framework for making better trading decisions. Start with the basics, practice consistently, and gradually refine your approach based on your experience and market observations.
The markets will always present challenges, but with a solid understanding of multi timeframe analysis, you'll be better equipped to navigate these challenges and capitalize on the opportunities they present.
This content is for educational purposes only and should not be considered financial advice. Trading involves substantial risk and may not be suitable for all investors. Always conduct your own research and consider consulting with a qualified financial advisor before making trading decisions.
Master the complete top-down analysis approach, which is essentially multi timeframe analysis applied systematically across all major markets.
Master the core concepts of BoS and CHoCH to identify key turning points across multiple timeframes for enhanced market structure analysis.
Learn how to classify price levels across different timeframes to find the highest probability trading opportunities using market structure analysis.
Discover how institutional traders use multi timeframe analysis within Smart Money Concepts to identify high-probability trading opportunities.
Trading & Investing Enthusiast
Teaching traders to understand market psychology, technical analysis, and investing through clear beginner-friendly insights.
Started investing at 16 and became fascinated by how market psychology influences price movements. Still learning something new every day.
Love sharing what I've learned along the way. There's nothing quite like helping someone understand a concept that once confused me too.
Proud to have built a community where traders actively share insights and grow together through daily market analysis and discussion.
Want to join our learning journey?
The tools I use for multi-chart layouts and timeframe sync