
Smart Money Concepts: The Ultimate Guide
Learn how institutional traders use candlestick patterns within the SMC framework.
Last Updated: December 20, 2025
Candlestick patterns are visual formations on trading charts that signal potential price movements. Each pattern reveals the battle between buyers and sellers, helping traders identify reversals and trend continuations. The key principle is reading the body size, wick length, and pattern context to anticipate where price may move next. This guide covers 20+ patterns with step-by-step trading strategies.
The body size determines candle strength—larger bodies indicate stronger momentum in that direction
Long wicks reveal buying or selling pressure: lower wicks show buyers stepping in, upper wicks show sellers defending
Reversal patterns like hammer, engulfing, and morning/evening star signal potential trend changes
Continuation patterns like flags and three methods help you trade with the trend during pullbacks
Context matters—patterns are more reliable when they appear at support, resistance, or with confirming indicators
Doji and spinning tops signal indecision and can serve as warning signs to exit trades or anticipate reversals
🎬 Over 500,000 traders have watched this YouTube course. Watch above or continue reading below.
💡 Click any timestamp to jump to that section in the article.
Candlestick patterns are one of the most powerful tools in a trader's arsenal. Whether you're trading stocks, forex, crypto, or any other financial market, understanding how to read and interpret these patterns can give you a significant edge.
This comprehensive guide covers everything from the absolute basics of reading candlestick charts to advanced trading strategies for specific patterns. By the end, you'll be able to identify key reversal and continuation patterns, understand what they signal about market sentiment, and apply practical trading strategies to capitalize on these signals.
The course is divided into five main chapters: reading candlesticks, pattern classifications, reversal patterns, continuation patterns, and special patterns like doji and spinning tops.
Before diving into patterns, you need to understand the fundamentals of how candlesticks work.
Every candlestick chart consists of two types of candles:
Bullish (Green) Candles: During this candle, price moves upward. The candle opens at a lower price and closes at a higher price.
Bearish (Red) Candles: During this candle, price moves downward. The candle opens at a higher price and closes at a lower price.
Each candlestick contains four critical data points, often abbreviated as OHLC:
Open: The price at the beginning of the time period. For a daily candle, this is the price when the market opens that day.
High: The highest price reached during the time period. This is represented by the top of the upper wick.
Low: The lowest price reached during the time period. This is represented by the bottom of the lower wick.
Close: The price at the end of the time period. For a daily candle, this is the price when the market closes.
Each candlestick represents a specific time period. Common timeframes include:
1-minute charts (each candle = 1 minute)
5-minute charts
15-minute charts
1-hour charts
4-hour charts
Daily charts
Weekly charts
The patterns and strategies in this guide work across all timeframes, though higher timeframes (4-hour, daily, weekly) tend to produce more reliable signals.
The Body (Real Body): The wide, colored portion of the candle. It shows the range between the open and close prices.
The Wicks (Shadows): The thin lines extending above and below the body. The upper wick shows how high price went before pulling back. The lower wick shows how low price went before recovering.
Not all candles are created equal. The size and shape of a candlestick tells you a lot about the strength of buyers versus sellers.
The larger the real body, the stronger the momentum in that direction. A large green body indicates strong buying pressure, while a large red body indicates strong selling pressure.
Consider two candles with the same high and low points but different body sizes. The candle with the larger body shows that the dominant side (bulls or bears) maintained control throughout the period, while a small body suggests neither side gained decisive control.
When you see a candle with a very small body and long wicks on both sides, this signals indecision. Neither buyers nor sellers could maintain control. These candles often appear at turning points in the market.
The wicks (or shadows) of a candlestick contain crucial information that many traders overlook.
When a candle has a long lower wick, it means price dropped significantly during that period but buyers stepped in and pushed it back up. The longer the lower wick, the stronger the buying pressure was at those lower levels.
This becomes especially significant at support levels. If price wicks below support but closes back above it, this suggests strong buying interest at that level.
Conversely, a long upper wick indicates that price rose significantly but sellers pushed it back down. This is a sign of selling pressure at higher levels.
At resistance levels, a long upper wick that fails to close above resistance is a bearish signal indicating that sellers are defending that level.
Momentum analysis helps you understand whether a trend is strengthening or weakening.
Track the size of real bodies over consecutive candles. In a healthy uptrend, you want to see consistently large green bodies. If the bodies start getting smaller, momentum is decreasing.
A momentum candle is one where the real body is at least twice the size of the previous candles' bodies. These candles signal a significant shift in market sentiment and often mark the beginning of strong moves.
The larger the momentum candle relative to recent candles, the more significant the signal. A candle that's three or four times larger than recent candles indicates very strong momentum.
I like to define momentum candles as a candlestick that is at least two times larger compared to the previous candles. Momentum candles can provide strong signals when we trade.
Every candlestick pattern can be classified by three characteristics:
Simple Patterns: Consist of only one candlestick (examples: hammer, shooting star, doji)
Complex Patterns: Consist of two or more candlesticks (examples: engulfing, morning star, three methods)
Bullish: Indicates price will rise after the pattern
Bearish: Indicates price will fall after the pattern
Neutral: Could go either way, depending on context (examples: doji, spinning top)
Reversal Patterns: Signal that the current trend is about to reverse direction
Continuation Patterns: Signal that the current trend will continue in the same direction
Reversal patterns are among the most valuable tools for traders because they help identify potential turning points in the market.
Classification: Complex | Bullish | Reversal
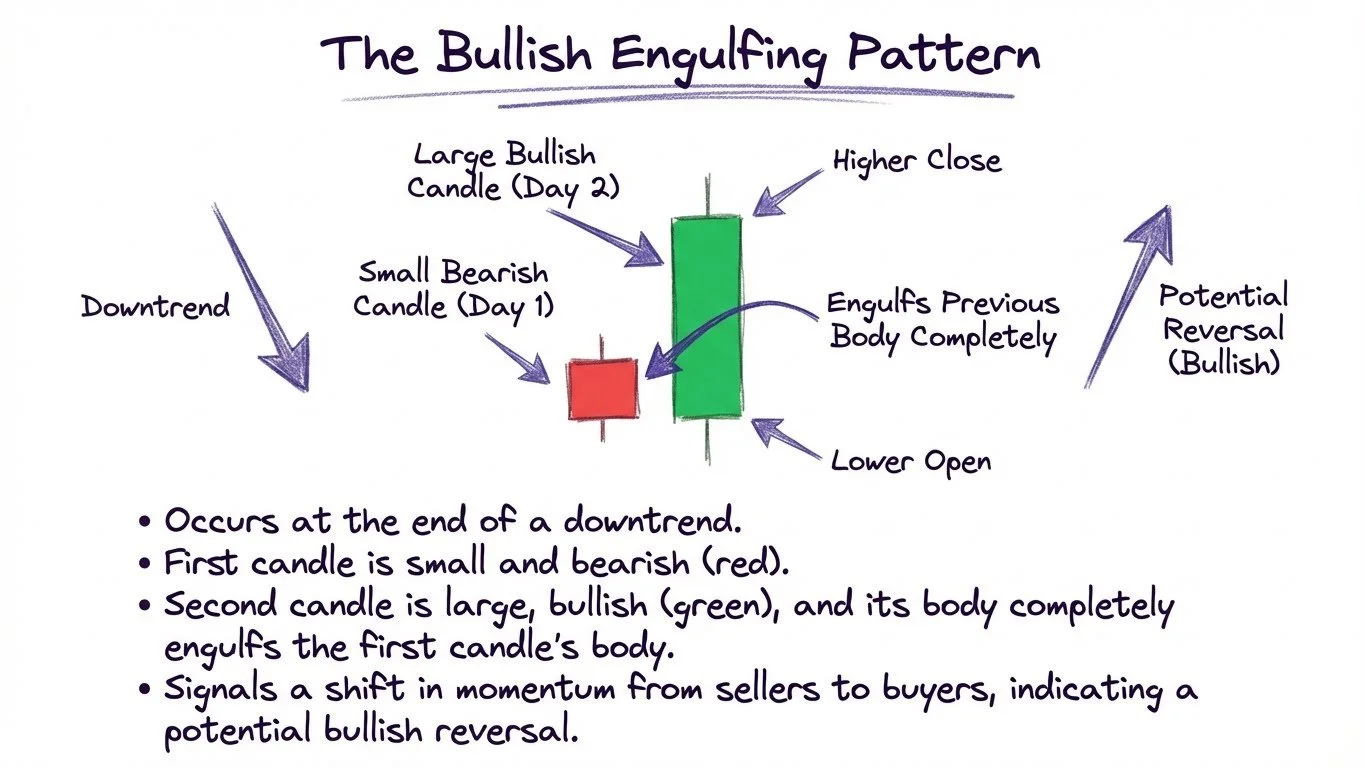
The bullish engulfing is one of the most reliable reversal patterns. It appears after a downtrend and signals a potential reversal to the upside.
How to Identify:
Must appear after a downtrend
First candle is a small red candle
Second candle is a large green candle
The green candle's body completely engulfs (covers) the red candle's body
Pattern confirms when the green candle closes
Trading Strategy:
Entry: At the close of the green engulfing candle
Stop Loss: Below the lowest point of the pattern (including wicks)
Target: Use a 2:1 risk-to-reward ratio, or target previous resistance levels
Pro Tip: The pattern is stronger when it appears at a support level or after a prolonged downtrend.
Classification: Complex | Bearish | Reversal
The bearish engulfing is the opposite of the bullish engulfing. It appears after an uptrend and signals a potential reversal to the downside.
How to Identify:
Must appear after an uptrend
First candle is a small green candle
Second candle is a large red candle
The red candle's body completely engulfs the green candle's body
Pattern confirms when the red candle closes
Trading Strategy:
Entry: At the close of the red engulfing candle
Stop Loss: Above the highest point of the pattern
Target: Use a 2:1 risk-to-reward ratio
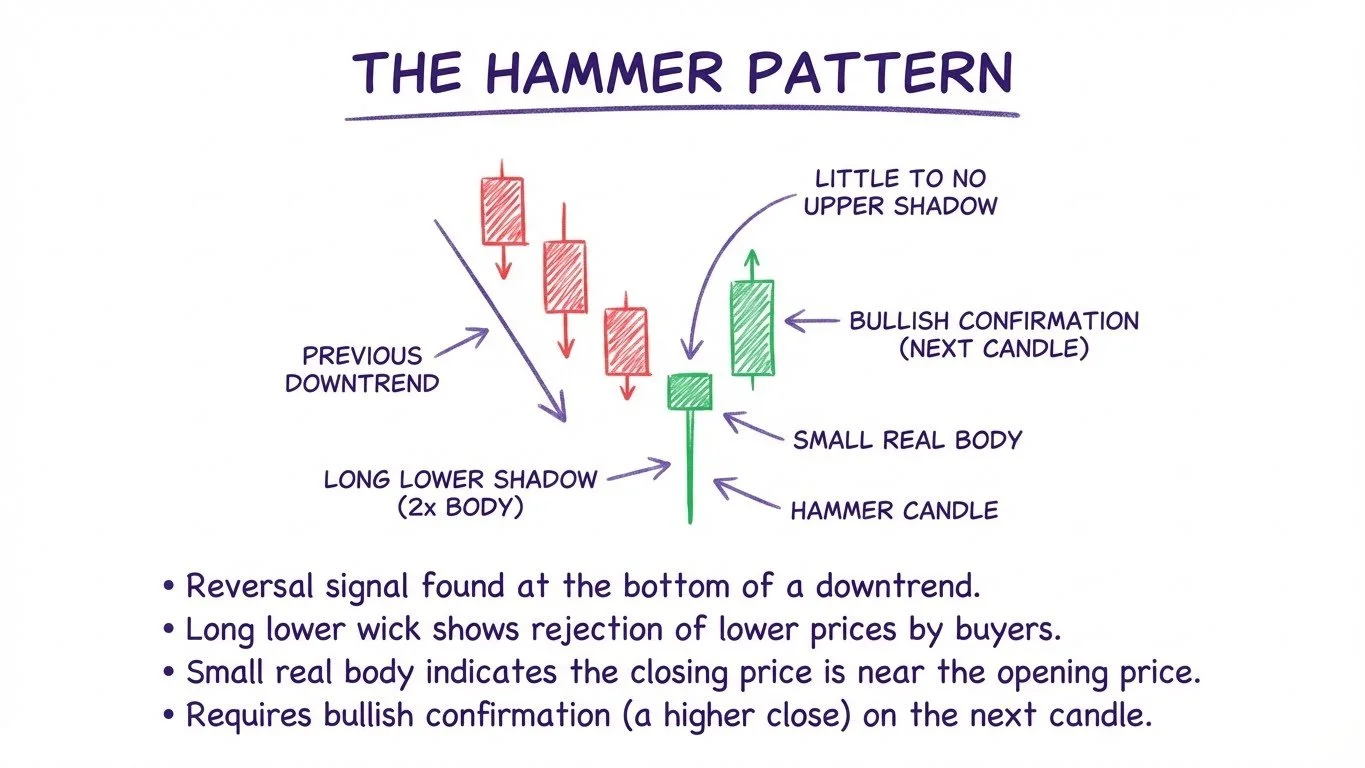
The hammer candlestick pattern: A bullish reversal signal identified by a small body and long lower wick after a downtrend.
Classification: Simple | Bullish | Reversal
The hammer is one of the most recognizable and reliable bullish reversal patterns.
How to Identify:
Must appear after a downtrend
Small real body at the top of the candle
Long lower wick (at least 2x the body length)
Little to no upper wick
Body can be either green or red (green is slightly more bullish)
Why It Works: During the candle, sellers pushed price down significantly, but buyers stepped in and pushed it back up near the open. This shows strong buying pressure at lower levels.
Trading Strategy:
Entry: At the close of the hammer candle
Stop Loss: Below the low of the hammer (with some buffer room)
Target: 2:1 risk-to-reward, or target previous resistance
The hammer pattern is one of my personal favorites. When we see a very strong movement before the hammer appears, it can actually make the hammer even stronger—this is a very strong reversal signal.
Classification: Simple | Bearish | Reversal
The shooting star is the bearish counterpart to the hammer. It appears after an uptrend and signals a potential reversal.
How to Identify:
Must appear after an uptrend
Small real body at the bottom of the candle
Long upper wick (at least 2x the body length)
Little to no lower wick
Body can be either green or red (red is slightly more bearish)
Why It Works: Buyers pushed price up during the candle, but sellers took control and pushed it back down. This rejection of higher prices is a bearish signal.
Trading Strategy:
Entry: At the close of the shooting star
Stop Loss: Above the high of the pattern
Target: 2:1 risk-to-reward
Important: Pay close attention to the upper wick length. If the wick is barely twice the body size, the signal is weaker than a shooting star with a wick 3-4x the body size.
Classification: Complex | Bullish | Reversal
The morning star is a three-candle pattern that signals a potential bullish reversal.
How to Identify:
Must appear after a downtrend
First candle: Strong red candle (continuation of downtrend)
Second candle: Small body (can be green or red) with a gap down from the first candle
Third candle: Strong green candle with a gap up from the second candle
Third candle must close above the 50% mark of the first candle's body
Trading Strategy:
Entry: At the close of the third candle
Stop Loss: Below the lowest point of the pattern
Target: Previous resistance or 2:1 risk-to-reward
Note: In markets like crypto where prices don't gap, look for the second candle to open at or below the first candle's close.
Classification: Complex | Bearish | Reversal
The evening star is the bearish counterpart to the morning star.
How to Identify:
Must appear after an uptrend
First candle: Strong green candle
Second candle: Small body with a gap up from the first candle
Third candle: Strong red candle with a gap down from the second candle
Third candle must close below the 50% mark of the first candle's body
Trading Strategy:
Entry: At the close of the third candle
Stop Loss: Above the highest point of the pattern
Target: Previous support or 2:1 risk-to-reward
Classification: Complex | Bullish | Reversal
The piercing pattern is essentially an early-stage bullish engulfing.
How to Identify:
Must appear after a downtrend
First candle: Strong red candle
Second candle: Green candle that opens below the first candle's low
Second candle closes above the 50% mark of the first candle's body (but doesn't engulf it)
Trading Strategy:
Entry: At the close of the green candle
Stop Loss: Below the lowest point of the pattern
Target: 2:1 risk-to-reward
Classification: Complex | Bearish | Reversal
The dark cloud cover is the bearish counterpart to the piercing pattern.
How to Identify:
Must appear after an uptrend
First candle: Strong green candle
Second candle: Red candle that opens above the first candle's high
Second candle closes below the 50% mark of the first candle's body
Trading Strategy:
Entry: At the close of the red candle
Stop Loss: Above the highest point of the pattern (or above the body if the wick is very long)
Target: 2:1 or 3:1 risk-to-reward
Classification: Simple | Bullish | Reversal
The inverted hammer looks bearish but is actually a bullish reversal pattern—context matters.
How to Identify:
Must appear after a downtrend (this is crucial)
Small real body at the bottom
Long upper wick (at least 2x the body)
Little to no lower wick
Why It's Bullish: Even though sellers pushed price back down, the fact that buyers managed to push it up significantly shows increasing buying interest after a downtrend.
Trading Strategy:
Entry: Some traders enter at the candle close; others wait for a confirmation candle (a green candle after the inverted hammer)
Stop Loss: Below the low of the inverted hammer
Target: 2:1 risk-to-reward
Classification: Simple | Bearish | Reversal
The hanging man looks exactly like a hammer but appears after an uptrend, making it a bearish signal.
How to Identify:
Must appear after an uptrend
Small real body at the top
Long lower wick (at least 2x the body)
Little to no upper wick
Body can be green or red (red is more bearish)
Why It's Bearish: Even though buyers recovered the price, the significant drop during the candle shows that sellers are gaining strength.
Trading Strategy:
Entry: At the candle close, or wait for a confirmation candle
Stop Loss: Above the high of the pattern (or above resistance if nearby)
Target: 2:1 or 3:1 risk-to-reward
Continuation patterns signal that the current trend is likely to continue. These are powerful because you're trading with the trend.
Classification: Complex | Bullish | Continuation
This five-candle pattern signals that a pullback in an uptrend is ending.
How to Identify:
Must appear during an uptrend
First candle: Strong green candle
Next three candles: Small red candles that stay within the range of the first candle (body of red candles should stay within the first candle's body range)
Fifth candle: Strong green candle that closes above the first candle's close
Trading Strategy:
Entry: At the close of the fifth candle
Stop Loss: Below the lowest point of the pattern
Target: Measured move (equal distance to the prior impulse) or 2:1 risk-to-reward
Classification: Complex | Bearish | Continuation
The bearish counterpart to the rising three methods.
How to Identify:
Must appear during a downtrend
First candle: Strong red candle
Next three candles: Small green or doji candles that stay within the first candle's range
Fifth candle: Strong red candle that closes below the first candle's close
Trading Strategy:
Entry: At the close of the fifth candle
Stop Loss: Above the highest point of the pattern
Target: Measured move or 2:1 risk-to-reward
Classification: Simple | Bullish or Bearish | Continuation
Momentum candles are one of my favorite patterns because they're easy to identify and frequently appear in the market.
How to Identify:
Look for a candle where the real body is at least 2x larger than the previous candles' bodies
The more candles it's larger than, the stronger the signal
Best when it appears after a consolidation or pullback
Bullish Momentum Candle Trading Strategy:
Entry: At the close of the momentum candle
Stop Loss: Below recent support or the low of consolidation
Target: Based on the chart pattern (ascending triangle breakout, etc.) or risk-to-reward
Bearish Momentum Candle Trading Strategy:
Entry: At the close of the momentum candle
Stop Loss: Above recent resistance or the high of consolidation
Target: Measured move or risk-to-reward
Classification: Complex | Bullish | Continuation
The bull flag is one of the most reliable continuation patterns. It appears frequently and is relatively easy to trade.
How to Identify:
Strong uptrend (the "pole")
Followed by 3+ small candles moving down or sideways (the "flag")
Flag candles have small bodies
Final candle: Green candle that closes above the last flag candle's open
Trading Strategy:
Entry: At the close of the breakout candle
Stop Loss: Below the lowest point of the flag
Target: Either the previous high, or a measured move (pole length projected from the flag low)
The bull flag is one of the best candlestick patterns out there. It appears super frequently in the market, it's a reliable pattern, and if you understand it, it's relatively simple to trade.
Classification: Complex | Bearish | Continuation
The bearish counterpart to the bull flag.
How to Identify:
Strong downtrend (the "pole")
Followed by 3+ small candles moving up or sideways (the "flag")
Flag candles have small bodies
Final candle: Red candle that closes below the last flag candle's open
Trading Strategy:
Entry: At the close of the breakdown candle
Stop Loss: Above the highest point of the flag
Target: Previous low or measured move
Classification: Simple | Bullish or Bearish | Continuation
Runaway gaps are powerful continuation signals, though they're less common than other patterns.
Bullish Runaway Gap:
Appears during an uptrend
A "true gap" where even the wicks don't touch between candles
Pattern confirms at the open of the candle after the gap
Entry: At the open after the gap
Stop Loss: Below the low of the gap
This allows for a gap fill without getting stopped out
Bearish Runaway Gap:
Appears during a downtrend
A true gap with no wick overlap
Pattern confirms at the open after the gap
Entry: At the open after the gap
Stop Loss: Above the high of the gap
Doji and spinning tops are special candles that signal indecision in the market. They can be powerful warning signs or reversal signals depending on context.
Indecision candles share these characteristics:
Small (or non-existent) real body
Relatively long wicks
Neither bulls nor bears are in control
Classic Doji: Open and close at virtually the same price, with wicks on both sides. Signals pure indecision.
Long-Legged Doji: Similar to classic doji but with very long wicks. Shows extreme volatility but no clear direction.
Dragonfly Doji: Open, close, and high are all at the same level with a long lower wick. This is a bullish signal, especially after a downtrend—similar to a hammer.
Gravestone Doji: Open, close, and low are all at the same level with a long upper wick. This is a bearish signal, especially after an uptrend—similar to a shooting star.
Four-Price Doji: Rare. All four prices (OHLC) are the same. Signals extreme uncertainty; often best to avoid trading.
For doji candles:
The higher the body, the more bullish
The lower the body, the more bearish
Spinning tops are similar to doji but allow for a slightly larger body. The rule: both the upper and lower wicks should be larger than the real body.
Like doji, spinning tops signal indecision and can serve as warning signs or potential reversal signals.
Doji candles work best as warning signals. If you're in a trade and multiple doji appear, consider:
Taking partial profits
Tightening your stop loss
Proceeding with caution
For reversal trades, dragonfly doji at support and gravestone doji at resistance can be valid entry signals, though many traders wait for confirmation.
A pattern appearing in isolation means little. Always consider:
Where on the chart does the pattern appear?
Is it at support or resistance?
What's the overall trend?
Are there confirming indicators?
Most strategies in this guide use a 2:1 risk-to-reward ratio. This means:
If you risk $100, you target $200 profit
You can be wrong more than half the time and still be profitable
For counter-intuitive patterns (like the inverted hammer or hanging man), waiting for a confirmation candle can improve your win rate at the cost of a slightly worse entry.
Candlestick patterns at key support and resistance levels are significantly more reliable than patterns appearing randomly in price.
Look for confluence: patterns that align with overall market structure, trend direction, and previous swing highs/lows.
The engulfing pattern (both bullish and bearish) is generally considered one of the most reliable candlestick patterns. It's easy to identify, appears frequently, and has a clear signal. The pattern is most reliable when it appears at key support or resistance levels with strong volume.
Yes, candlestick patterns work on all timeframes from 1-minute charts to monthly charts. However, patterns on higher timeframes (4-hour, daily, weekly) tend to be more reliable because they represent more market participants and filter out short-term noise.
The hammer and hanging man have identical shapes—small body at top with long lower wick. The difference is context: a hammer appears after a downtrend and is bullish, while a hanging man appears after an uptrend and is bearish. The same candle signals opposite things depending on where it appears.
It depends on the pattern. For straightforward patterns like engulfing, entering at the pattern close is often sufficient. For counter-intuitive patterns like the inverted hammer or hanging man, waiting for a confirmation candle can improve your win rate, though you may get a slightly worse entry price.
A doji indicates indecision in the market—neither buyers nor sellers gained control during that period. On its own, a doji is neutral, but context matters. Multiple dojis after a trend can signal weakening momentum and a potential reversal. A dragonfly doji at support is bullish; a gravestone doji at resistance is bearish.
The most common method is to place your stop-loss just beyond the extreme point of the pattern (below the low for bullish patterns, above the high for bearish patterns). Always leave some "wiggle room" to avoid getting stopped out by normal price fluctuations. Also consider nearby support/resistance levels when setting stops.
Absolutely. Candlestick patterns work on any financial market including crypto, stocks, forex, and commodities. One difference with crypto: since markets trade 24/7, you won't see price gaps between candles as often. For patterns requiring gaps (like morning star), look for the second candle to open at or below the first candle's close instead.
A momentum candle is one where the real body is at least twice the size of the previous candles' bodies. It signals a significant shift in market sentiment and often marks the beginning of strong moves. Momentum candles are especially powerful when they break out of consolidation patterns or key levels.
Learn how institutional traders use candlestick patterns within the SMC framework.
Understand trend direction to interpret candlestick patterns more accurately.
Patterns at key S/R levels are significantly more reliable—learn to identify them.
Combine RSI with candlestick patterns for stronger trade confirmation.
Candlesticks are the foundation—take your price action skills to the next level.
Trading educator with 300K+ YouTube subscribers. Focused on teaching retail traders technical analysis, candlestick patterns, Smart Money Concepts, and price action strategies. All content is for educational purposes only and does not constitute financial advice.
Trading & Investing Enthusiast
Teaching traders to understand market psychology, technical analysis, and investing through clear beginner-friendly insights.
Started investing at 16 and became fascinated by how market psychology influences price movements. Still learning something new every day.
Love sharing what I've learned along the way. There's nothing quite like helping someone understand a concept that once confused me too.
Proud to have built a community where traders actively share insights and grow together through daily market analysis and discussion.
Want to join our learning journey?
Practice identifying candlestick patterns on live charts