
Break of Structure (BOS) and Change of Character (CHoCH) Trading Strategy
Deep dive into BOS and CHoCH signals to identify key turning points in any market.
Whether you're trading stocks, forex, crypto, or any other financial market, understanding market structure is essential for consistent success. This comprehensive guide breaks down everything you need to know—from the absolute basics to advanced concepts—so you can trade market structure like a pro and profit in both bull and bear markets.
Market structure is the framework of swing highs and swing lows that defines whether a market is trending up, trending down, or moving sideways. By identifying Break of Structure (BOS) for trend continuation and Change of Character (CHOCH) for potential reversals, traders can read any chart objectively and find high-probability entry points.
📺 Watch the full market structure trading masterclass on YouTube, or continue reading for the complete guide.
💡 Click any chapter to jump to that section in the article.
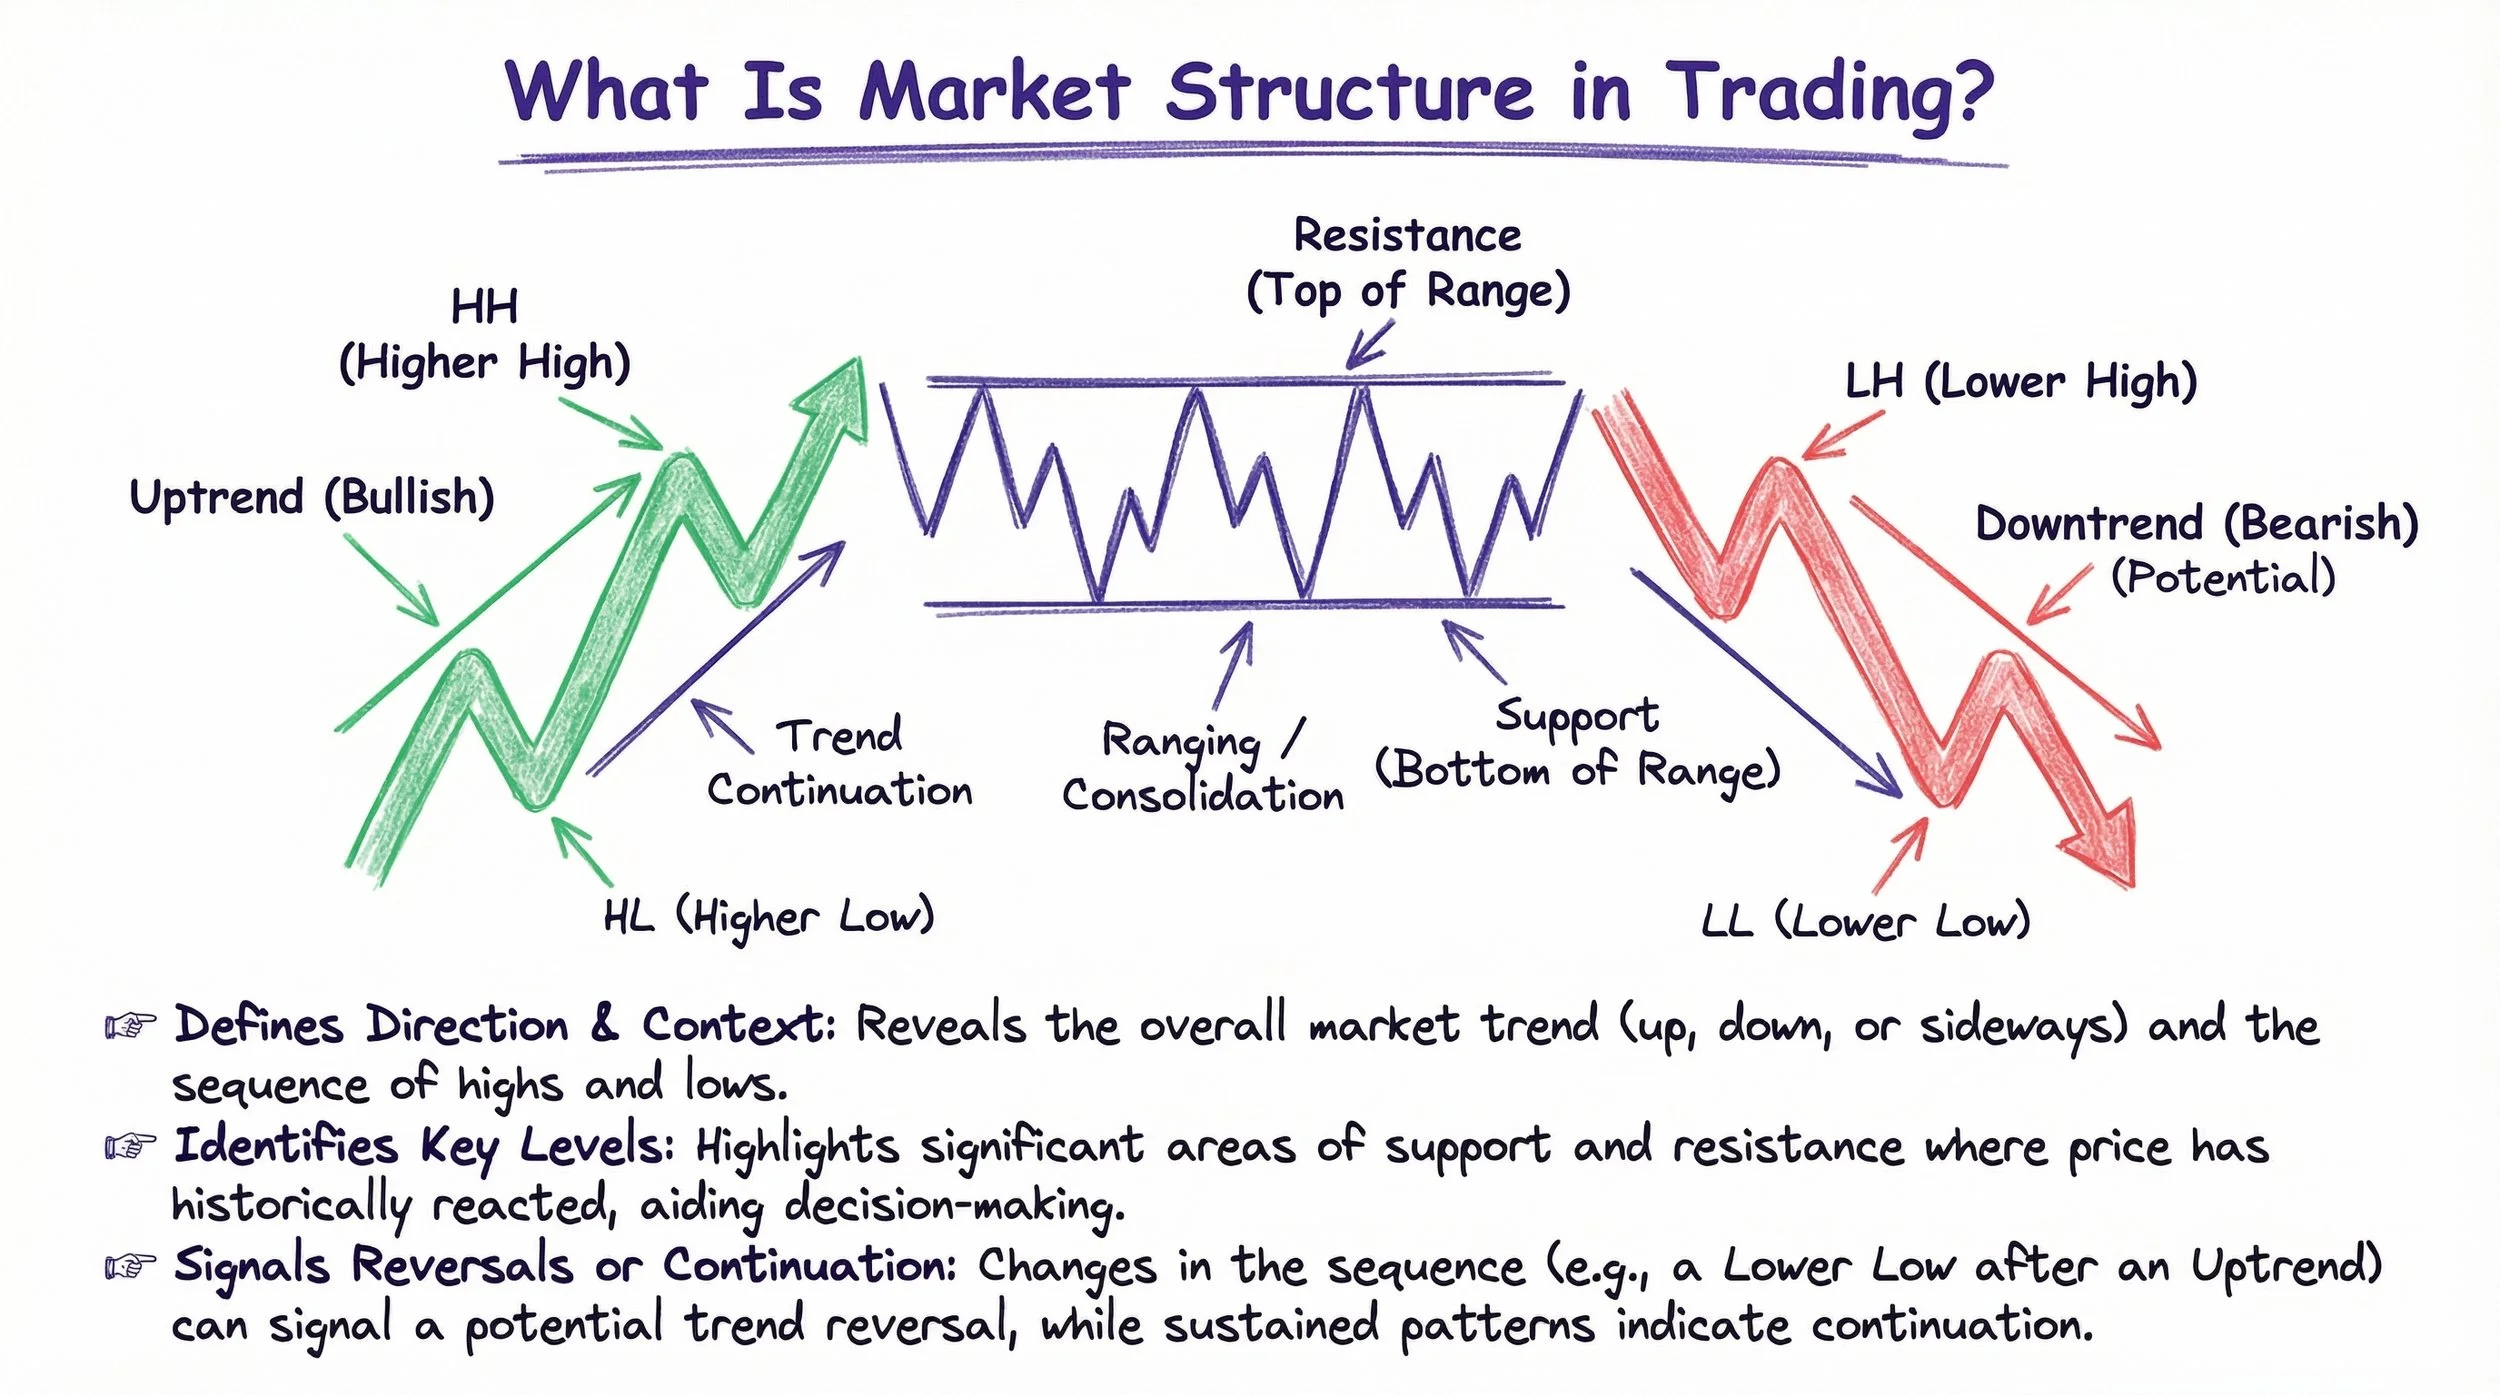
Market structure is the "big picture" of any chart—the major swing highs and lows that define trend direction and help you identify whether to trade long, short, or wait.
Every trend follows the same rhythm: impulse moves (strong directional pushes) followed by pullbacks (counter-moves or consolidations). Master this pattern and you're ahead of most traders.
Break of Structure (BOS) signals trend continuation, while Change of Character (CHOCH) provides early warning of potential reversals—these two signals keep your analysis objective and mechanical.
Not all swing points are equal: strong levels (that caused BOS) tend to hold when retested, while weak levels (that failed to break structure) often get taken out.
Multi-timeframe analysis improves entries: use higher timeframes to identify the trend, then zoom into lower timeframes for precise entry points.
Trading is about patience—avoid choppy markets, wait for clean structure, and only trade when conditions favor your strategy.
What is Market Structure in Trading?
Market structure is the big picture of the market—the skeleton that gives shape to every chart. When you zoom out and look at the market as a whole, you're analyzing market structure. It shows you the major highs and lows, the trend direction (uptrend, downtrend, or sideways), and the overall path price has traveled.
Think of market structure as the macro view of the chart. It answers the fundamental question: "Where are we in the market right now?"
But there's another layer to every chart: price action. This is the micro structure—the small movements inside each swing. Price action focuses on individual candles, candlestick patterns, and momentum characteristics. When you zoom in to analyze what's happening right now at a specific price level, you're looking at price action.
"Market structure is basically the macro structure—where we are in the market and the overall picture. While microstructure shows what is happening right now."
The key distinction is simple: market structure tells you the big picture direction, while price action helps you find precise entries and exits within that structure.
Swing Highs and Swing Lows in Trading
Swing points are the fundamental building blocks of market structure. Every chart, regardless of the asset or timeframe, is composed of these essential elements.
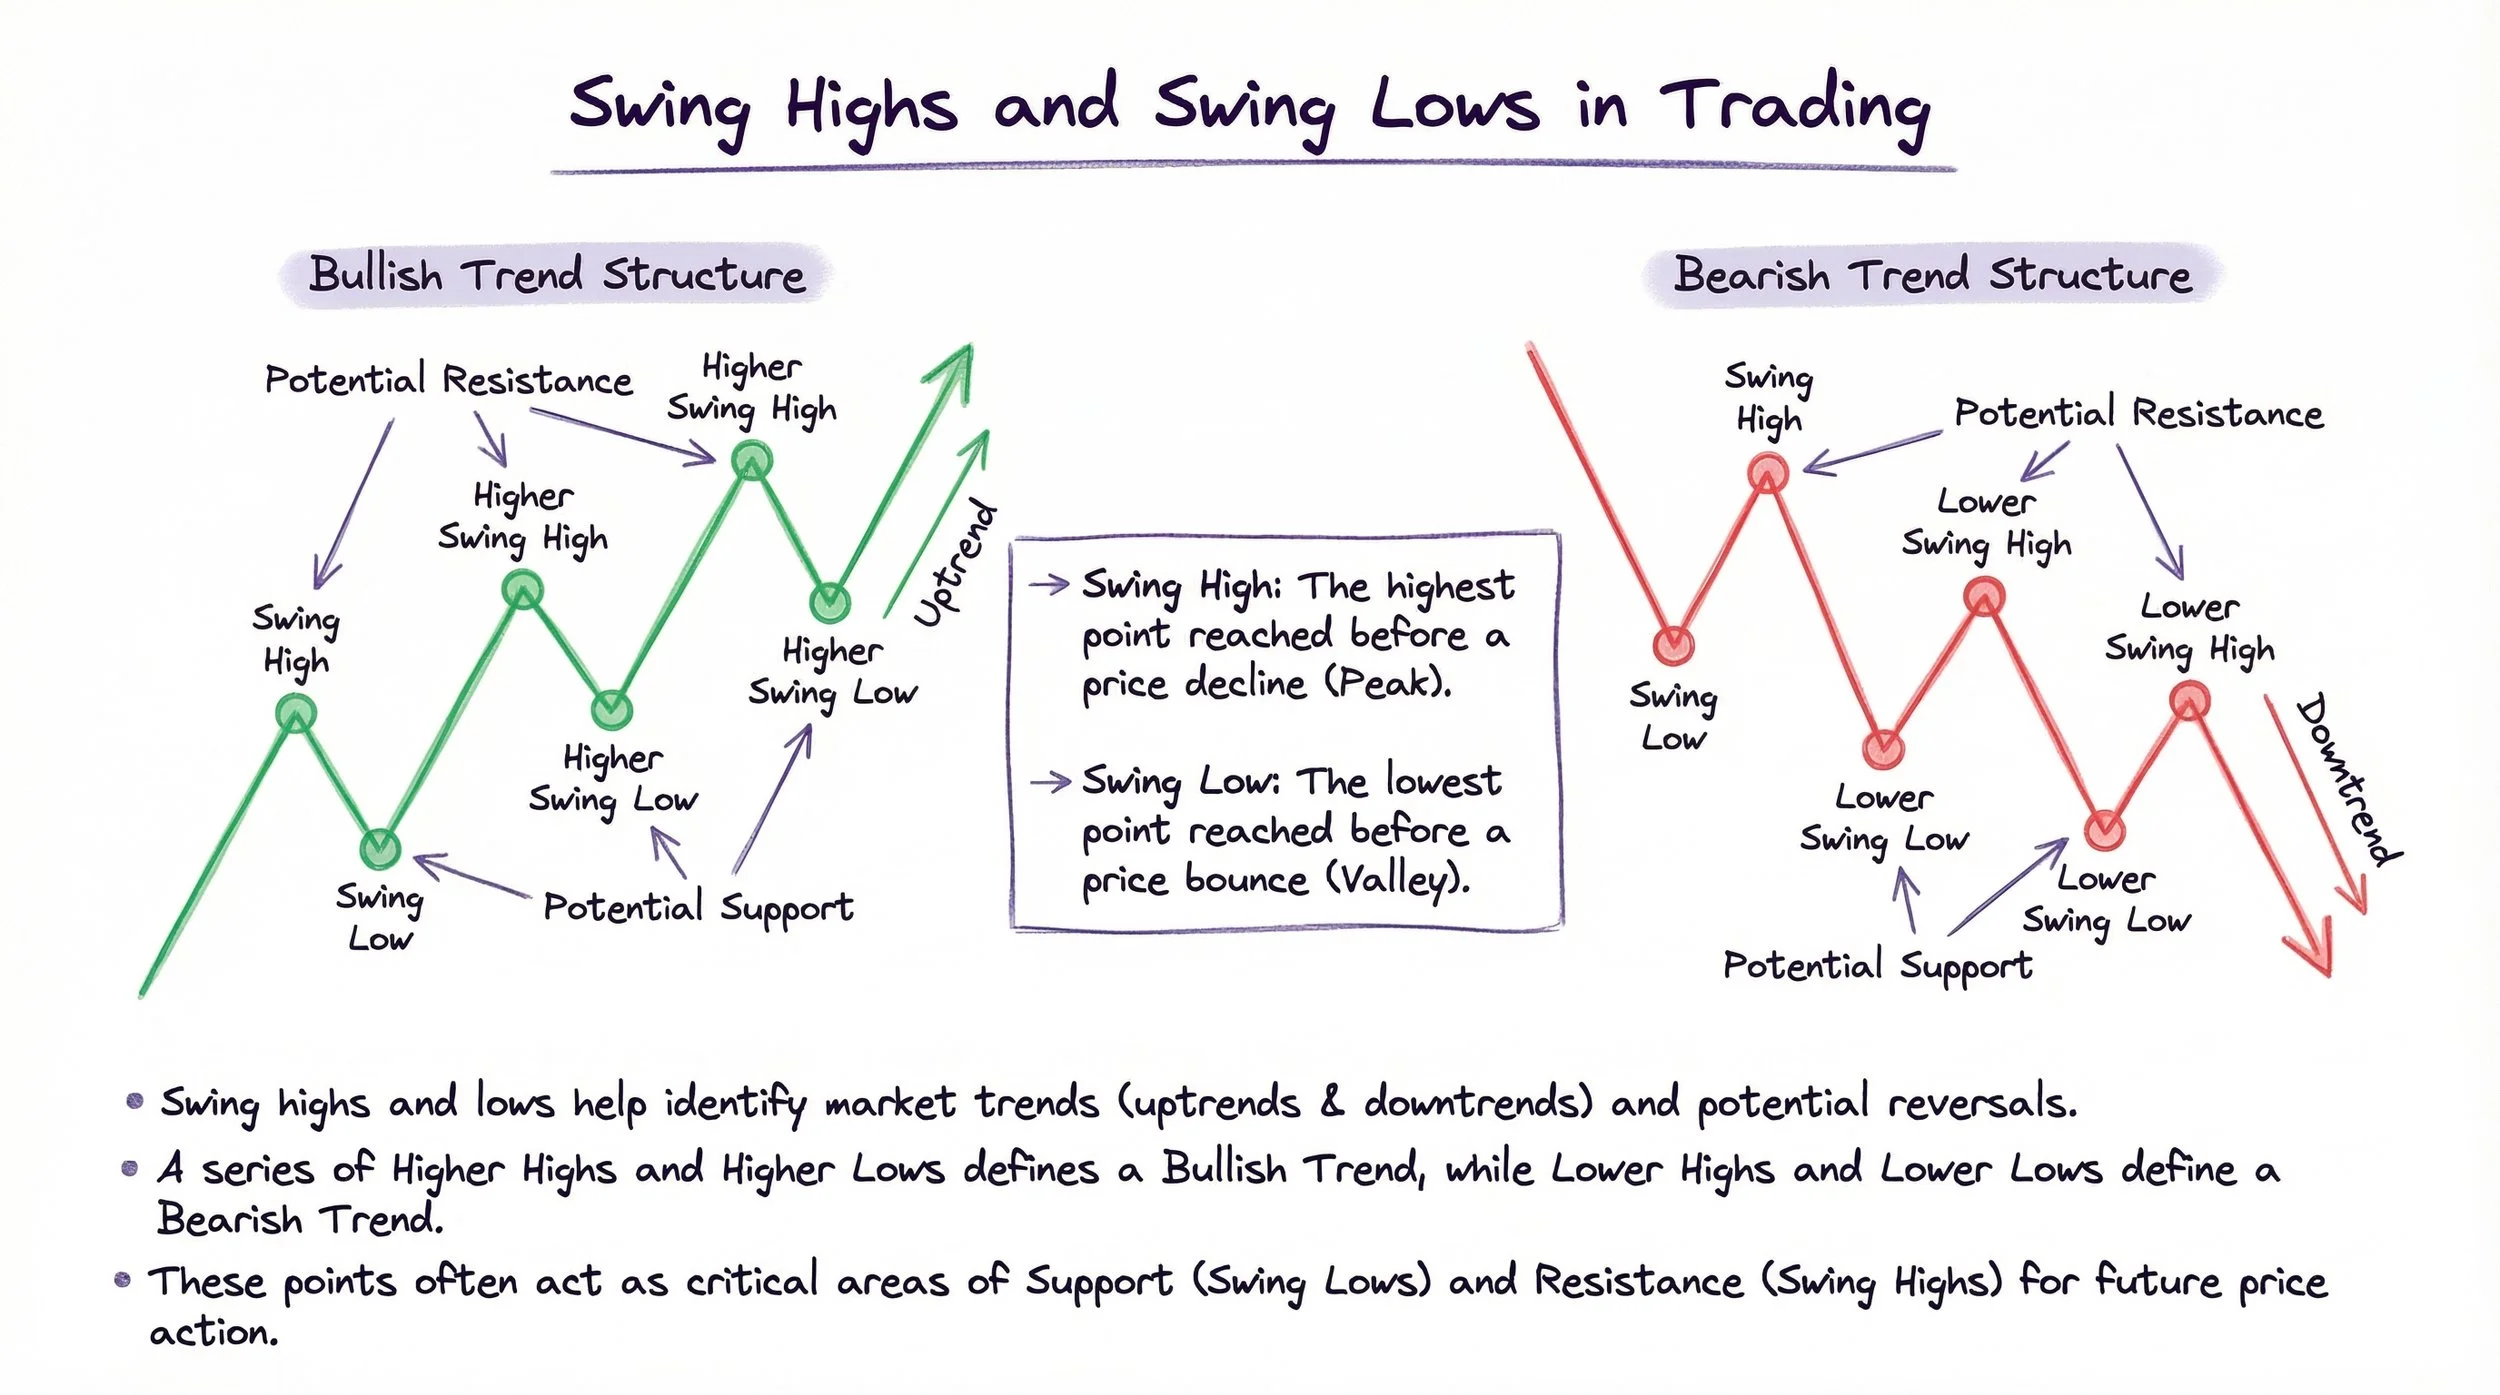
A swing high is a peak where price turned downward. These points often mark potential resistance zones and reversal areas. A swing low is the opposite—a valley where price turned upward, marking support and potential bounce zones.
In an uptrend, you'll see a series of swing highs and lows where each subsequent high is higher than the previous (higher highs) and each subsequent low is also higher (higher lows). The definition of an uptrend requires both: consecutive higher highs AND consecutive higher lows.
Here's where it gets more nuanced: within each major swing, you'll find minor swings—smaller moves and turns inside the larger movement. This concept is known as fractals. When you zoom in on any part of the structure, you'll see the same pattern repeating at a smaller scale.
This fractal nature is why most technical analysis concepts work across all timeframes. The market behaves similarly whether you're looking at a daily chart or a five-minute chart, with only minor differences.
Exercise: Open up a chart and start by marking only the major swings. Don't worry about every minor fluctuation—focus on the larger structure first. This practice helps you see the forest before analyzing individual trees.
Impulse Moves and Pullbacks in Trading
Markets move in waves. Every trending market follows the same rhythm: strong moves followed by pauses. Understanding this pattern is the foundation of all trend trading.
The two types of moves you need to recognize are:
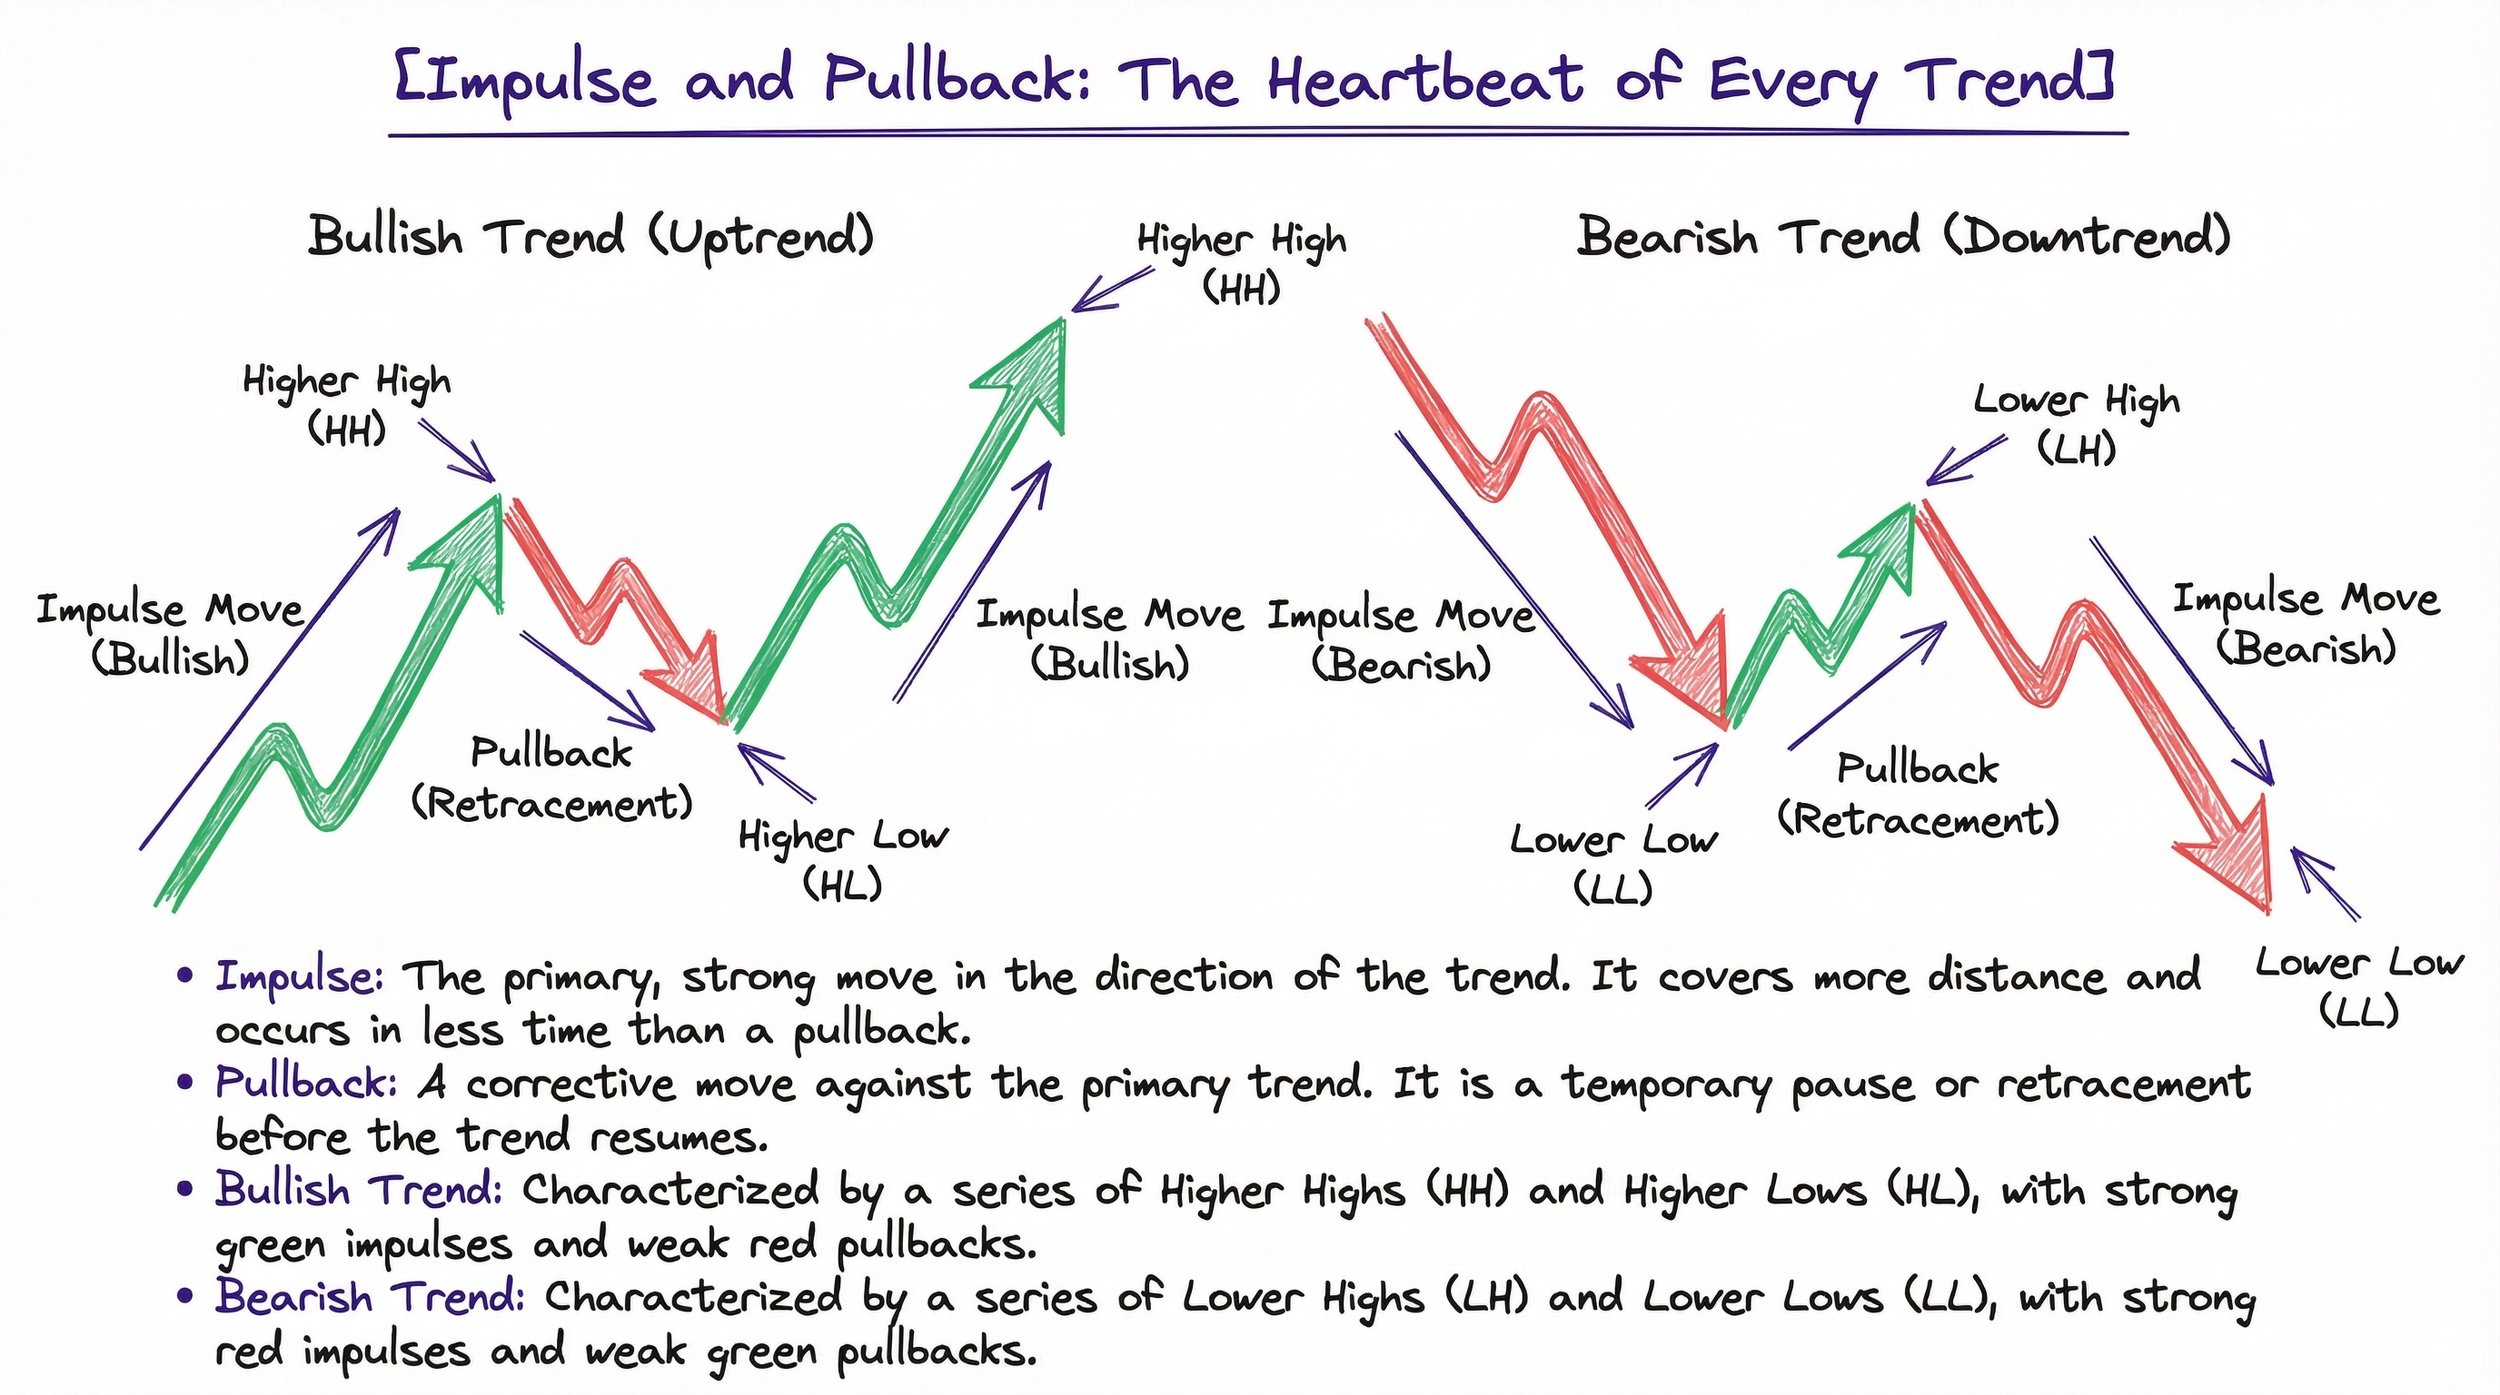
Impulse Moves: These are the strong, fast moves in the direction of the trend. In an uptrend, impulse moves feature larger candles, more candles of the same color (green), and clear momentum. You'll notice the price covering significant ground quickly.
Pullbacks: These are the counter-moves against the trend—the pauses or retracements. Pullbacks typically show mixed candles, smaller bodies, more wicks, and less steep angles. The price consolidates or retraces some of the impulse move's gains.
"Impulse plus pullback equals the basic heartbeat of every trend. If you master this pattern, you will be ahead of most traders."
Pullbacks come in two main varieties:
Simple Pullbacks: One clean counter-move that's easy to identify. The price pulls back in a relatively straight line before resuming the trend.
Complex Pullbacks: Multiple waves within the pullback, creating a more intricate pattern. These can fool traders into thinking a trend change is occurring when it's just a deeper consolidation.
For beginners, focus on trading simple pullbacks first. Complex pullbacks require more experience to navigate correctly without getting shaken out prematurely.
Before entering any trade, you need to identify what state the market is in. Different trading strategies work in different market conditions—forcing a trend strategy in a ranging market is a recipe for losses.
Uptrend: Characterized by higher highs AND higher lows. Both conditions must be present. If you see higher highs but not higher lows, you're not in a true uptrend—you might be in a range or messy transition.
Downtrend: The opposite of an uptrend, featuring lower highs AND lower lows. Again, both conditions must be met.
Range (Sideways Market): Highs and lows stay at approximately the same level. The price oscillates between support and resistance without making progress in either direction. The boundaries don't need to be perfectly flat, but there's no clear directional bias.
There's also a fourth state worth mentioning: the transition state. This is when the market is so messy you can't clearly identify whether it's trending or ranging. When you encounter a transition market, the best strategy is often to simply wait. Don't force trades in choppy, unclear conditions.
"Different market states require different trading strategies. Never force a trend trading strategy in a trading range."
Identify the state first, then choose your strategy
Here's a powerful concept: big trends contain small trends. The same patterns you see on a daily chart also appear on the 1-hour chart, which appear again on the 5-minute chart. This fractal nature allows you to use multiple timeframes to improve your entries.
The basic process works like this:
Higher Timeframe (Macro View): Start here to identify the overall context and bias. Determine the trend direction—are you bullish, bearish, or neutral? This might be your daily or 4-hour chart.
Lower Timeframe (Micro View): Zoom in to the last part of the structure to find more precise entries. What looks like a pullback on the daily chart might be a complete downtrend on the 1-hour chart—and that's exactly what you want to trade.
For beginners, two timeframes are sufficient. Use one to identify the main trend and another to refine your entry. You don't need to overcomplicate things with three or four timeframes until you're more experienced.
The key insight is that when your higher timeframe shows an uptrend and your lower timeframe shows a pullback (which appears as a short-term downtrend), you can look for the breakout from that pullback to enter with the larger trend.
The Fibonacci retracement is a powerful tool for measuring pullback depth and setting profit targets—but many traders use it incorrectly. The Fibonacci isn't a magical predictor of price levels. Instead, it's an objective tool that helps you measure how far price has retraced and where it might find support.
Here's how it works: when you draw a Fibonacci retracement from a swing low to a swing high, the tool divides that range into key percentage levels: 23.6%, 38.2%, 50%, 61.8%, and so on. These numbers represent how much of the original move has been retraced.
The Golden Zone is the area between 38.2% and 61.8%. Most healthy pullbacks in trending markets retrace to somewhere within this zone before the next impulse move begins.
However, in very strong trends, pullbacks tend to be shallower—ending in the 23.6% to 38.2% zone instead. When you see consistently shallow pullbacks, it's a sign of strong momentum.
Measured Moves: Another useful concept is that the next impulse often equals the size of the previous one. By measuring the length of an impulse move and projecting that distance from the pullback low, you can estimate potential profit targets. This gives you an objective, rules-based approach to setting targets rather than guessing.
Two terms will transform how you read market structure: Break of Structure (BOS) and Change of Character (CHOCH).
Break of Structure (BOS): This signals trend continuation. In an uptrend, a BOS occurs when price breaks above the previous swing high. It confirms the trend is still intact and continuing. Each BOS represents another leg in the existing trend.
Change of Character (CHOCH): This is the first indication that a trend change may be occurring. In an uptrend, a CHOCH happens when price breaks below the most recent swing low—the first meaningful break against the established trend.
Important distinction: a CHOCH alone doesn't guarantee a trend reversal. It's an early warning signal. To confirm a complete trend change, you need a Break of Structure in the new direction after the CHOCH.
You may also hear the term Market Structure Shift (MSS). Most traders use this interchangeably with CHOCH. To avoid confusion, stick with BOS and CHOCH—these terms are clearly defined and widely understood.
"BOS indicates continuation. CHOCH is the early warning of a potential trend change. These two signals will keep your reading very simple and clear."
The two signals that keep your trend reading objective
Price breaks the previous swing point in the trend direction
Price breaks the previous swing point against the trend direction
Here's a concept that separates intermediate traders from beginners: not all swing points have equal significance.
Strong Levels: These are swing points that caused a successful Break of Structure. The swing low that initiated the move breaking to a new high is a strong low. Strong levels are more likely to hold when retested because they've already proven their significance.
Weak Levels: These are swing points that failed to break structure or cause a change of character. A high that formed but didn't lead to a new low (in a downtrend) is a weak high. Weak levels are more likely to get taken out—they haven't demonstrated structural significance.
Why does this matter? Strong levels make excellent areas for stop-loss placement and potential entry zones. When price returns to a strong level, you can look for bounces. Weak levels, on the other hand, are often targets—price tends to sweep through them to grab liquidity before reversing.
Let's get practical with two reliable entry methods:
Model A: The Pullback Entry
Identify a clear uptrend with confirmed BOS signals
Wait for price to pull back
Define the pullback structure with trend lines (resistance above, support below)
Choose your entry: aggressive (at support during pullback) or conservative (on breakout from pullback structure)
Look for confirmation: candlestick patterns like hammers, or momentum candles on breakouts
Set stop-loss below the pullback low
Target using measured moves or fixed risk-to-reward ratios (2:1 or 3:1)
Model B: The Failure Test (2B Pattern)
This entry capitalizes on failed breakouts—when price briefly breaks a level then snaps back.
Wait for price to break a key level (support or resistance)
Watch for the break to fail—price closes back inside the range
Look for candlestick confirmation (hammers work excellently here)
Enter when price reclaims the level it briefly broke
Set stop-loss beyond the wick of the failure (past the extreme point)
Why does the failure test work? Failed breakouts trap traders on the wrong side. When their stop-losses get hit, it creates additional momentum in your favor. You're essentially trading alongside the smart money that engineered the trap.
Trend lines and channels can clarify your analysis—but only if used properly. Many beginners overuse them or draw them incorrectly.
Rising Trend Line: Connects higher lows in an uptrend. It shows the rhythm and angle of the trend.
Falling Trend Line: Connects lower highs in a downtrend.
Important: A broken trend line does NOT automatically mean the trend has reversed. The trend only reverses when you get a CHOCH (and eventually a confirming BOS in the new direction). Trend line breaks indicate the character of the trend is changing, but the trend itself may continue.
Trend Channels: Create parallel lines to form a channel. The lower line connects swing lows, and you copy that exact slope to draw the upper boundary through swing highs. Channels help you estimate where impulse moves might reach and when they're overextended.
If price breaks above the channel, it suggests the trend is accelerating. If it breaks below, the trend may be weakening. But always confirm with actual structure breaks rather than relying solely on trend line violations.
Not all market conditions deserve your attention. Learning to recognize market quality can save you from countless losing trades.
Smooth Markets: Feature clear impulse moves, clean pullbacks, and obvious BOS/CHOCH signals. The structure is easy to read, and your analysis has a higher probability of being correct.
Choppy Markets: Characterized by overlapping swings, frequent fake signals, trapped traders everywhere, and constantly changing structure. These markets are nearly random and extremely difficult to trade profitably.
"Markets are actually pretty random most of the time. Our job as traders is to find the moments and conditions when they behave in a more predictive manner."
On lower timeframes (like the 1-minute chart), markets tend to be choppier. Higher timeframes (daily, 4-hour) typically offer cleaner structure. When you encounter a choppy market, the best strategy is often to simply wait. Trading is more about patience than constant action.
Market structure tells you WHERE something is happening. Order flow and volume tell you WHO is active and HOW MUCH activity is occurring.
Volume: The simplest order flow tool. Higher volume on a candle means more participants agreed with that move, making it more significant. Look for volume spikes on breakouts—they validate the move. In uptrends, you want to see rising volume on impulse moves and declining volume on pullbacks.
Volume Profile: Shows volume at price levels rather than at specific candles. Taller bars indicate more trading activity at that price. High-volume areas often act as magnets for price and can serve as support or resistance.
Footprint Charts: Provide an "X-ray" view inside each candle, showing buying and selling volume at every price level within the candle. These are more advanced tools but incredibly powerful for reading order flow.
Delta: The net difference between buying and selling pressure. Positive delta suggests more aggressive buying; negative delta indicates more aggressive selling.
Volume confirmation doesn't guarantee success, but it significantly improves your probability. When structure and volume align, your edge increases.
One insight that elevates your trading: not everyone in the market is trading like you. Understanding this prevents frustration and helps you interpret price action more accurately.
Speculators/Traders: This is you. Directional traders who profit from price moving up or down.
Arbitrageurs: Exploit price differences between markets or instruments. They're market-neutral, not betting on direction.
Hedgers: Use markets for risk management, often taking positions opposite to their existing exposure. They might buy or sell regardless of where they think price is going.
Why does this matter? Not every price move is "manipulation" or aimed at taking out your stop. Different players value price differently, and lots of market activity has nothing to do with directional speculation. Structure sometimes looks "wrong" because not everyone is playing the same game. Keep your expectations realistic and avoid the trap of blaming the market for your losses.
Here's a systematic process for every trade:
Identify market state — Uptrend, downtrend, range, or choppy?
Mark major swing highs and lows — Find the structure skeleton
Note BOS and CHOCH signals — Where has structure been broken?
Identify strong vs weak levels — Which levels are significant?
Evaluate pullback quality — Does it show healthy characteristics?
Choose an entry model — Pullback entry or failure test?
Refine with lower timeframe — Get more precise entry
Confirm with volume — Is there participation validating the move?
Set stop-loss — Below structure for longs, above for shorts
Set targets — Use measured moves or fixed risk-to-reward
You don't need to follow every step rigidly forever. As you gain experience, you'll naturally refine the process. Some steps will become intuitive, and you may find certain elements more useful than others. The key is having a systematic approach that removes emotional decision-making.
"Trading is already hard as it is. Having some form of mechanical rules can help you so much."
Use this 10-step process before every trade
💡 Pro Tip: Don't skip steps. The process removes emotion and keeps your trading mechanical.
Let's walk through a complete analysis:
Step 1: On the daily chart of a stock, identify we're in an uptrend—consecutive higher highs and higher lows with clear BOS signals.
Step 2: Mark the structure. We see impulse, pullback, impulse, pullback—the classic heartbeat pattern.
Step 3: The most recent swing low is a strong level (it initiated a BOS). The most recent swing high is where we need a break for continuation.
Step 4: The current pullback shows mixed candles with smaller bodies—healthy pullback characteristics.
Step 5: Zoom to the 1-hour chart. The daily pullback appears as a short-term downtrend. We can define this with descending trend lines.
Step 6: Wait for price to break above the pullback's resistance with a momentum candle and volume.
Step 7: Enter on the breakout, stop below the pullback low, target using the measured move from the previous impulse.
This methodical approach takes emotion out of trading and gives you a repeatable edge.
"I've been teaching these concepts to my community of over 300,000 traders, and what I've found is that mastering market structure—the basics of impulse, pullback, BOS, and CHOCH—puts you ahead of most traders. The key breakthrough comes when you stop forcing trades and start waiting for the structure to be clear. Trading is actually much more about waiting than constant action."
Market structure is the "big picture"—the major swing highs and lows that define trend direction. It tells you WHERE you are in the market. Price action is the "micro" view—the individual candles, patterns, and momentum characteristics. It tells you WHAT is happening right now. Use market structure to determine your directional bias, then use price action for precise entries and exits.
An uptrend requires BOTH higher highs AND higher lows. A downtrend requires BOTH lower highs AND lower lows. If only one condition is met, you may be in a range or transition period. Look for confirmed Break of Structure (BOS) signals to validate the trend direction.
Break of Structure (BOS) signals trend continuation—when price breaks the previous swing point in the trend direction. Change of Character (CHOCH) signals the first meaningful break against the trend and can indicate a potential reversal. A CHOCH alone doesn't confirm reversal; you need a subsequent BOS in the new direction for confirmation.
Yes, market structure concepts are fractal—they apply equally to daily, 4-hour, 1-hour, or even 5-minute charts. However, higher timeframes tend to produce cleaner, more reliable structure. Lower timeframes are often choppier. Many traders use multiple timeframes: higher for direction, lower for entries.
The Golden Zone refers to the 38.2% to 61.8% Fibonacci retracement levels. Most healthy pullbacks in trending markets retrace to somewhere within this zone before the next impulse move begins. In very strong trends, pullbacks may be shallower (23.6% to 38.2%).
Strong levels are swing points that caused a successful Break of Structure—they've proven their significance and are more likely to hold when retested. Weak levels are swing points that failed to break structure or cause a change of character—they often get taken out. Strong levels make good stop-loss placements and entry zones.
Generally, yes. Choppy markets feature overlapping swings, frequent fake signals, and constantly changing structure. They're nearly random and very difficult to trade profitably. The best strategy in choppy conditions is often to simply wait for cleaner structure to develop. Trading is more about patience than constant action.
Beginners often benefit from starting with the daily or 4-hour timeframe. These higher timeframes have cleaner structure with less noise, giving you more time to analyze and make decisions. As you gain experience, you can add lower timeframes for more precise entries.
Market structure is one of two core pillars of trading (the other being price action). Now that you understand the framework, your next step is to practice identifying these patterns on real charts. Open TradingView, pick any chart, and start marking swing highs, swing lows, BOS, and CHOCH signals.
Remember: trading is a long-term game. These concepts take time to internalize. Focus on mastering the basics before moving to advanced techniques. Back-test your strategies, forward-test them with small size, and continuously refine your approach.
The traders who succeed aren't the ones who know the most—they're the ones who execute consistently on a few core concepts. Market structure is that foundation.
Deep dive into BOS and CHoCH signals to identify key turning points in any market.
Learn how institutional traders move markets and how to trade alongside them.
Learn to classify price levels and identify which swing points are likely to hold or break.
Master the building blocks of market structure with this complete swing point guide.
Trading educator with 300K+ YouTube subscribers. Focused on teaching retail traders institutional concepts including Smart Money, market structure, price action, and technical analysis. All content is for educational purposes only.
Trading & Investing Enthusiast
Teaching traders to understand market psychology, technical analysis, and investing through clear beginner-friendly insights.
Started investing at 16 and became fascinated by how market psychology influences price movements. Still learning something new every day.
Love sharing what I've learned along the way. There's nothing quite like helping someone understand a concept that once confused me too.
Proud to have built a community where traders actively share insights and grow together through daily market analysis and discussion.
Want to join our learning journey?
Mark swing highs, lows, BOS & CHOCH on live markets