
Break of Structure (BoS) and Change of Character (CHoCH) Trading Strategy
Deep dive into advanced BOS and CHoCH strategies with real trading examples to identify optimal entry and exit points in trending markets.
Are you more of a visual learner? Don't worry, in this YouTube video, you will learn everything you need to get started with market structure trading, from marking swing highs and lows to identifying Break of Structure (BOS) and Change of Character (CHoCH) patterns that professional traders use to time their entries and exits.
Market structure is the foundational framework showing price movement patterns over time, helping you identify whether markets are trending up, down, or moving sideways
Uptrends require both higher highs (HH) and higher lows (HL), while downtrends need lower highs (LH) and lower lows (LL) to be confirmed
Break of Structure (BOS) signals trend continuation—occurring when price breaks above a previous high in uptrends or below a previous low in downtrends
Change of Character (CHoCH) can indicate potential reversals—happening when price breaks the significant level that created the last BOS, suggesting the trend's character may be shifting
Successful market structure trading combines trend identification, swing point analysis, and pattern recognition with proper risk management—no pattern guarantees success, so stop losses remain essential
Understanding market structure is one of the most fundamental skills in technical analysis. Whether you're analyzing forex pairs, stocks, or cryptocurrencies, knowing how to read market structure can help you identify where trends start, continue, and potentially reverse. In this comprehensive guide, we'll break down everything you need to know about market structure trading, including the critical concepts of Break of Structure (BOS) and Change of Character (CHoCH).
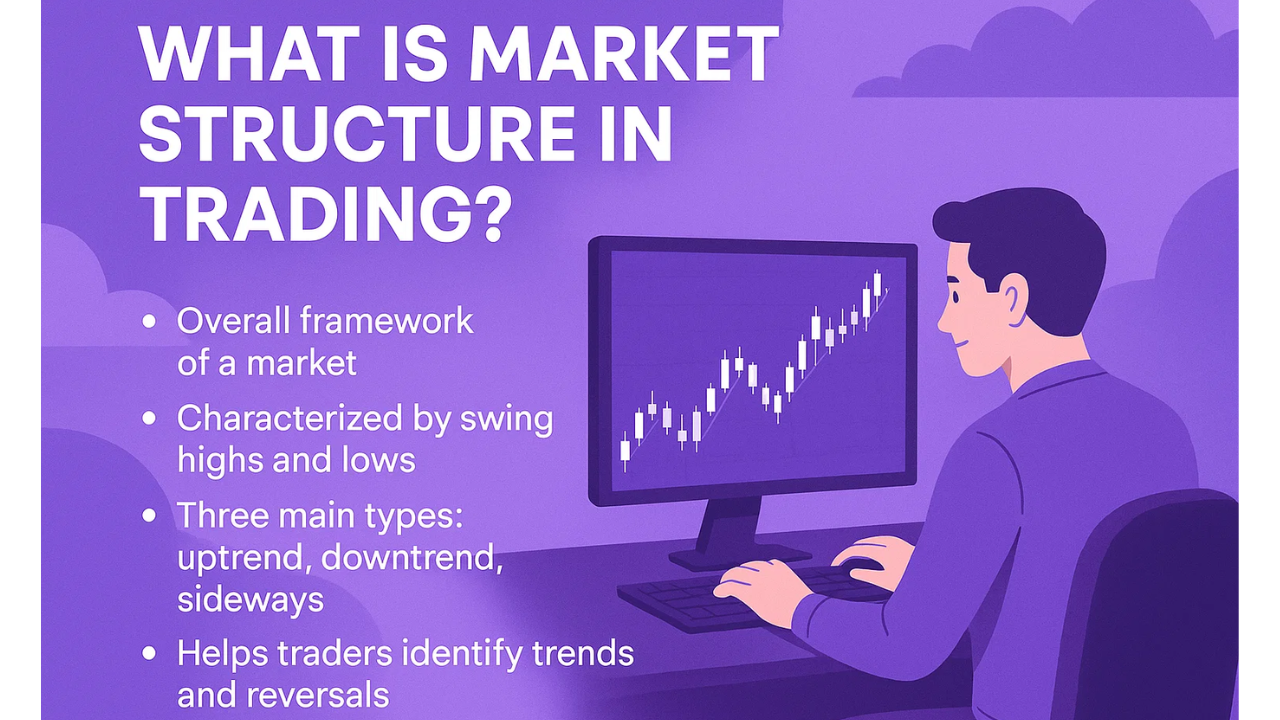
What is Market Structure in Trading?
Market structure represents the big picture framework of price movement over time. When you look at any candlestick chart, what you're actually observing is market structure unfolding in real-time. Think of it as the battlefield map showing the ongoing war between bulls (buyers pushing prices up) and bears (sellers pushing prices down).
At its core, market structure analysis helps traders answer three critical questions:
Is the market trending up, down, or moving sideways?
Where might the current trend continue or reverse?
What are the key price levels that may influence future movements?
The beauty of market structure trading is that it applies universally across all timeframes and markets. Whether you're swing trading stocks on daily charts or scalping forex on 5-minute charts, these principles remain consistent.
Who's in Control: Buyers (Bulls)
Trading Opportunity: Buy pullbacks at higher lows
Key Signal: Each dip gets defended and rallies to new highs
Who's in Control: Sellers (Bears)
Trading Opportunity: Sell rallies at lower highs
Key Signal: Each rally gets rejected and drops to new lows
Who's in Control: Neither (Balanced)
Trading Opportunity: Buy support, sell resistance
Key Signal: Price oscillates without clear direction
Use TradingView's advanced charting tools to mark swing highs and lows, draw trendlines, and identify which state the market is in across multiple timeframes. Their platform can help you spot these patterns before other traders do.
Access professional charting tools to identify trends, ranges, and reversals with precision
Markets can exist in one of three primary states at any given time. Understanding which state you're currently in can significantly improve your trading decisions and help you avoid common mistakes.
An uptrend occurs when the price consistently creates both higher highs (HH) and higher lows (HL). This pattern indicates that buyers are in control and willing to push prices to new peaks while also establishing support at progressively elevated levels.
In an uptrend, each pullback (which creates a higher low) represents a potential buying opportunity, as bulls typically step in to defend these levels and push prices higher again. Professional traders often look for these higher lows as strategic entry points to align with the dominant trend.
Conversely, a downtrend is characterized by the price printing both lower highs (LH) and lower lows (LL). This pattern shows that sellers dominate the market, consistently pushing prices to new lows while creating resistance at progressively lower levels.
During downtrends, each rally that forms a lower high can represent a selling opportunity, as bears typically emerge to push prices back down. Understanding this pattern helps traders avoid the common mistake of trying to "catch a falling knife" by buying too early.
The third state is a trading range, also called consolidation or a sideways market. This occurs when the price moves laterally between established support and resistance levels, with neither bulls nor bears gaining clear control.
During consolidation, you'll notice a mix of highs and lows that don't follow a clear directional pattern. Instead, the price oscillates within defined boundaries. Many traders find ranges challenging because breakout attempts often fail, leading to whipsaw losses. However, ranges also create opportunities for mean-reversion strategies where traders can buy near support and sell near resistance.
Before we dive deeper into Break of Structure and Change of Character, you need to understand how to identify swing highs and swing lows on your charts.
A swing high is a peak in price where the candles on both sides are lower. It represents a point where buyers pushed prices up, but then sellers stepped in to drive prices back down.
A swing low is a trough in price where the candles on both sides are higher. This shows a point where sellers pushed prices down, but buyers then emerged to lift prices back up.
These swing points serve as the building blocks of market structure analysis. By connecting these highs and lows, you can visualize the current trend and anticipate where the market might be heading next.
Now we arrive at one of the most powerful concepts in market structure trading: the Break of Structure, commonly abbreviated as BOS.
A Break of Structure occurs when:
In an uptrend: The price breaks above a previous swing high
In a downtrend: The price breaks below a previous swing low
Think of a BOS as confirmation that the current trend is continuing with strength. When you see a BOS, it signals that the dominant market participants (bulls in an uptrend, bears in a downtrend) maintain control and are pushing prices to new extremes.
Let's walk through a practical example. Imagine you're analyzing an uptrend on your chart:
The price creates a swing high at a certain level
The price pulls back to form a higher low
The price then rallies and breaks above the previous swing high
That break above the previous high is your Break of Structure. It confirms that buyers stepped in during the pullback and have now pushed prices to a new high, validating the uptrend's continuation.
In a downtrend, the process works in reverse:
The price creates a swing low at a certain level
The price rallies to form a lower high
The price then declines and breaks below the previous swing low
That break below the previous low is your BOS in a downtrend, confirming that sellers remain in control.
When you identify a Break of Structure, it can help inform several aspects of your trading:
Trend confirmation: A BOS validates that the current trend remains intact
Entry timing: The pullback after a BOS can offer a lower-risk entry point
Stop loss placement: You can place stops below the recent higher low (in uptrends) or above the recent lower high (in downtrends)
Profit targets: BOS patterns can help you project where the next leg of the trend might extend
However, it's crucial to remember that no pattern works 100% of the time. Markets can experience false breakouts where a BOS appears to form, only for the price to reverse. This is why risk management remains essential regardless of how strong a pattern appears.
While Break of Structure signals trend continuation, Change of Character (CHoCH) can indicate that the trend might be exhausting and a reversal could be developing.
A Change of Character occurs when the price breaks below a significant low (in an uptrend) or above a significant high (in a downtrend) that previously caused a Break of Structure.
This is a more nuanced concept, so let's break it down carefully.
In an uptrend, you need to identify which pullback low caused the most recent BOS. Once you've identified that critical low, a CHoCH occurs when the price breaks below it. This suggests that the bulls may be losing control and bears are stepping in with enough force to break important support.
In a downtrend, you identify which rally high caused the most recent BOS. A CHoCH occurs when the price breaks above that critical high, suggesting that bears may be weakening and bulls are emerging.
The key distinction lies in what each pattern tells you:
BOS = "The trend is healthy and continuing" (break to new high/low)
CHoCH = "The trend might be changing" (break of the level that created the last BOS)
Think of BOS as the green light for trend-following trades, while CHoCH serves as a yellow light warning you that the trend's character is shifting and you should exercise caution.
One challenge with CHoCH is determining which low or high is "significant" enough to matter. Here are some guidelines:
Look for lows/highs that created clear BOS: Not every swing point matters equally. Focus on the pullbacks or rallies that led to obvious breaks of structure.
Consider the timeframe context: What appears significant on a 5-minute chart might be minor structure on a daily chart. The higher the timeframe, the more weight you should give to the structure.
Identify the most recent significant level: When in doubt, focus on the most recent low (in an uptrend) or high (in a downtrend) that caused a meaningful BOS. Earlier levels become less relevant as the trend develops.
Spotting a single CHoCH doesn't automatically confirm a full trend reversal. For a complete reversal confirmation, you typically want to see:
A Change of Character (breaking the significant level)
The formation of your first lower high (if reversing from uptrend) or higher low (if reversing from downtrend)
A Break of Structure in the opposite direction (breaking to a lower low in a new downtrend, or higher high in a new uptrend)
For example, if you're in an uptrend and you see:
A CHoCH (break below the significant higher low)
Formation of a new high that's lower than the previous high (first lower high)
A break below that creates a new lower low (BOS in the new downtrend)
At this point, you have a confirmed downtrend with both lower highs and lower lows established.
Follow this systematic approach for every trade setup
Determine if you're in an uptrend (HH/HL), downtrend (LH/LL), or range before trading
→ Sets your directional biasIdentify and mark major swing highs and lows on your chart
→ Creates reference points for patternsConfirm trend continuation with a clear Break of Structure
→ Enter on pullback, not at extremesStay alert for Change of Character signaling weakening momentum
→ Tighten stops or take profitsCombine with support/resistance, volume, and multiple timeframes
→ Always manage risk properlyProfessional charting platform with all the tools you need for market structure analysis
Now that you understand the core concepts, let's discuss how to apply market structure analysis in your trading.
Before entering any trade, first determine whether the market is in an uptrend, downtrend, or range. This provides your directional bias and helps you avoid counter-trend trades that work against the dominant force.
On your chart, identify and mark the major swing highs and swing lows. These serve as your reference points for spotting BOS and CHoCH patterns.
If you're trading with the trend, wait for a clear BOS to confirm the trend's continuation. The pullback following a BOS often provides a better entry point than buying at the highs or selling at the lows.
As the trend develops, stay alert for CHoCH patterns that might signal weakening momentum. When you spot a CHoCH, consider tightening your stops or taking partial profits to protect your gains.
While market structure is powerful, it works best when combined with other forms of analysis:
Support and resistance zones: These provide context for where BOS and CHoCH might occur
Volume analysis: Increasing volume on a BOS adds confirmation; declining volume might suggest weakness
Multiple timeframes: A BOS on a higher timeframe carries more weight than on a lower timeframe
Risk management: Always use appropriate position sizing and stop losses regardless of how strong the structure appears
Even experienced traders sometimes misread market structure. Here are common pitfalls to watch out for:
A BOS on a 1-minute chart doesn't carry the same significance as a BOS on a daily chart. Always consider the timeframe you're analyzing and give more weight to structure on higher timeframes.
Not every price movement represents a clear BOS or CHoCH. Sometimes the market is simply chopping around without clear structure. Don't force patterns where they don't exist—wait for clean, obvious setups.
Many new traders see a CHoCH and immediately try to fade the trend. Remember that one CHoCH doesn't confirm a reversal. Wait for the full sequence: CHoCH, then opposite high/low formation, then BOS in the new direction.
No pattern guarantees success. Even the cleanest BOS can fail, and false breakouts occur regularly. Always use stop losses and proper position sizing to protect your capital.
Market structure is relatively simple at its core—highs, lows, and the relationships between them. Don't overcomplicate it with too many rules or exceptions. Keep your analysis clean and straightforward.
As you develop your market structure skills, you'll notice that not all swing highs and lows carry equal weight. This leads us to the concept of minor versus major structure.
Major structure refers to the larger, more significant swing points that define the primary trend. These are the highs and lows visible on higher timeframes that create the "big picture" trend.
Minor structure consists of smaller swing points within the major structure. These are often only visible when you zoom into shorter timeframe charts.
Understanding this distinction helps you filter out noise and focus on the structure that matters most for your trading timeframe. A break of minor structure might provide a short-term scalping opportunity, while a break of major structure could signal a significant trend shift.
The principles of market structure apply universally, but different markets can display unique characteristics:
Currency pairs often trend smoothly with clear BOS and CHoCH patterns due to the market's high liquidity and 24-hour nature. However, ranges can persist for extended periods when there's no clear fundamental driver.
Individual stocks may show choppier structure than forex due to lower liquidity. However, major indices typically display clean structure that's easier to read. Earnings announcements and company-specific news can create sudden structure breaks.
Crypto markets can exhibit explosive BOS patterns with rapid price expansion. However, they're also prone to sharp reversals and false breakouts due to lower overall market maturity and sometimes thinner liquidity.
Build your edge by mastering these concepts in order
Understanding trends, BOS, CHoCH, swing points
Zones where institutional traders entered positions
Price imbalances that may get filled
Quick spikes to stop out traders before reversing
Market structure teaches you to read price movement. Once you can identify trends and key levels, you can then spot where institutions are operating through order blocks, fair value gaps, and liquidity manipulation. Master the foundation first—advanced concepts build on top.
Track smart money movements with AI-powered analysis from professional investors
Access the same data institutions use to make trading decisions
Perfect for Smart Money Trading: See where institutions are buying, identify accumulation patterns, and combine with your market structure analysis to trade alongside the big players.
Market structure forms the foundation of many advanced trading methodologies, including Smart Money Concepts (SMC). In SMC trading, market structure is combined with concepts like:
Order blocks (where institutional traders entered positions)
Fair Value Gaps (imbalances in price that may get filled)
Liquidity grabs (when price quickly spikes to stop out traders before reversing)
Understanding market structure first provides the framework you need to effectively apply these more advanced concepts.
Use horizontal lines and trendlines to mark swing highs and lows
Automated indicators that identify and mark swing points for you
Analyze 3 timeframes: your trading TF + one higher + one lower
Start with manual marking to develop your skills, then add indicators for confirmation. Always analyze multiple timeframes to understand both the big picture trend and short-term structure.
TradingView provides everything you need for professional market structure analysis
50+ drawing tools including horizontal lines, trendlines, fibonacci, and custom shapes
Including swing point detection, pivot points, and custom market structure indicators
View up to 8 timeframes simultaneously with synchronized analysis
Cloud sync keeps your marked structure accessible from any device
Join 50+ million traders using TradingView
While market structure can be identified with the naked eye, several tools can help:
Many traders simply use horizontal lines or trendlines to mark significant highs and lows on their charts. This keeps your analysis clean and uncluttered.
Some platforms offer indicators that automatically identify and mark swing highs and lows. While these can be helpful, be careful not to rely on them exclusively—manual analysis develops your market reading skills.
Use multiple chart timeframes to see both the major and minor structure. A common approach is to analyze structure on three timeframes: your trading timeframe, one level higher, and one level lower.
Break of Structure (BOS) occurs when the price breaks to a new high in an uptrend or a new low in a downtrend, signaling that the current trend is continuing. Change of Character (CHoCH) happens when the price breaks below a significant low (in an uptrend) or above a significant high (in a downtrend) that previously caused a BOS, suggesting the trend's character may be changing and a potential reversal could be developing.
Focus on swing points that created clear Break of Structure patterns and consider your timeframe context. Higher timeframe structure carries more weight than lower timeframe structure. Generally, you should mark lows that caused obvious breaks to new highs in uptrends, and highs that caused clear breaks to new lows in downtrends. When in doubt, focus on the most recent significant levels.
Yes, market structure principles apply universally across all timeframes from 1-minute charts to monthly charts. However, structure on higher timeframes typically carries more significance. Many traders use a multi-timeframe approach, analyzing structure on their trading timeframe plus one level higher and one level lower for better context.
No, a single CHoCH doesn't automatically confirm a full trend reversal. For complete reversal confirmation, you typically want to see: (1) a Change of Character, (2) the formation of your first opposite swing point (lower high if reversing from uptrend, or higher low if reversing from downtrend), and (3) a Break of Structure in the new direction. Until all three occur, the original trend may still resume.
Start by reviewing historical charts and practice identifying BOS and CHoCH patterns after they've formed. Use paper trading to apply your structure analysis risk-free before trading real money. Keep a trading journal with screenshots of your analysis and note whether patterns played out as expected. Focus on mastering one market and timeframe initially before expanding to others.
In ranging markets, you'll see a mix of highs and lows that don't follow a clear directional pattern. The price oscillates between support and resistance levels without creating consistent higher highs/higher lows or lower highs/lower lows. During consolidation, market structure analysis is less useful for directional trades, but you can use range boundaries for mean-reversion strategies—buying near support and selling near resistance.
Like any trading skill, reading market structure improves dramatically with practice. Here's how to develop your market structure analysis abilities:
Historical chart analysis: Review past price action and practice identifying BOS and CHoCH patterns after the fact
Paper trading: Apply your structure analysis in a risk-free environment before trading real money
Journaling: Keep screenshots of your structure analysis and note whether patterns played out as expected
Focus on one market initially: Master structure in one instrument before expanding to others
Study various timeframes: Practice reading structure on everything from 5-minute to monthly charts
The goal is to reach a point where identifying market structure becomes second nature—where you can glance at a chart and immediately recognize the current state and key levels.
Disclaimer: This content is for educational purposes only and should not be considered financial advice. Trading involves substantial risk of loss. Market structure analysis does not guarantee profitable trades. Always conduct your own research, understand your risk tolerance, and consider consulting with a licensed financial advisor before making any investment decisions. Past performance of any trading strategy or pattern does not guarantee future results.
Deep dive into advanced BOS and CHoCH strategies with real trading examples to identify optimal entry and exit points in trending markets.
Master the art of identifying and trading swing points—the foundational building blocks of market structure analysis.
Learn to classify price levels by strength within market structure to find the highest probability trading setups.
Discover how institutional traders hunt liquidity at key market structure levels and how you can identify these patterns.
Trading & Investing Enthusiast
Teaching traders to understand market psychology, technical analysis, and investing through clear beginner-friendly insights.
Started investing at 16 and became fascinated by how market psychology influences price movements. Still learning something new every day.
Love sharing what I've learned along the way. There's nothing quite like helping someone understand a concept that once confused me too.
Proud to have built a community where traders actively share insights and grow together through daily market analysis and discussion.
Want to join our learning journey?
Chart BOS & CHoCH patterns • Track institutional money flows • Analyze multiple timeframes