
Best Moving Average Indicators & Settings for TradingView
Discover the most powerful moving average combinations and optimal settings for different trading styles and market conditions.
Like watching over reading? Don't worry, in this YouTube video you will learn everything covered in the article, from what moving averages are to advanced indicators like HMA and ALMA. I'll show you how to use MAs for support/resistance, spot high-probability breakouts, and share the exact settings for different trading styles. Perfect for visual learners who want to see these strategies in action on real charts.
Moving averages are statistical calculations that smooth price data and help identify trends, with each having a length (periods) and type (SMA, EMA, HMA, etc.)
For support and resistance strategies, only use moving averages in clearly defined trends and always combine them with other technical analysis tools for higher success rates
Flat moving averages indicate market equilibrium where price movements become random - avoid using MA strategies during these conditions
High-probability breakouts show four key signs: increased momentum, strong candle closes, higher volume, and price action confirmation
Advanced indicators like the Hull Moving Average (HMA) and ALMA offer superior responsiveness and smoothness compared to traditional SMAs and EMAs, potentially improving your trading edge
If you're looking to master moving average trading strategies, you've come to the right place. In this comprehensive guide, I'll walk you through everything from basic concepts to advanced indicators like the Hull Moving Average (HMA) and ALMA that most traders don't even know exist.
Moving averages are one of the most fundamental yet powerful tools in technical analysis. Whether you're trading stocks, crypto, Forex, or any other financial market, understanding how to use moving averages effectively can significantly improve your trading results.
But here's the thing: most traders only scratch the surface of what moving averages can do. They know about the SMA 50 or EMA 20, but they miss out on the advanced techniques and lesser-known indicators that can give them a real edge in the markets.
In this guide, I'll share insights from extensive research and practical trading experience to help you understand not just what moving averages are, but how to use them effectively in real trading scenarios.
What is a Moving Average in Trading?
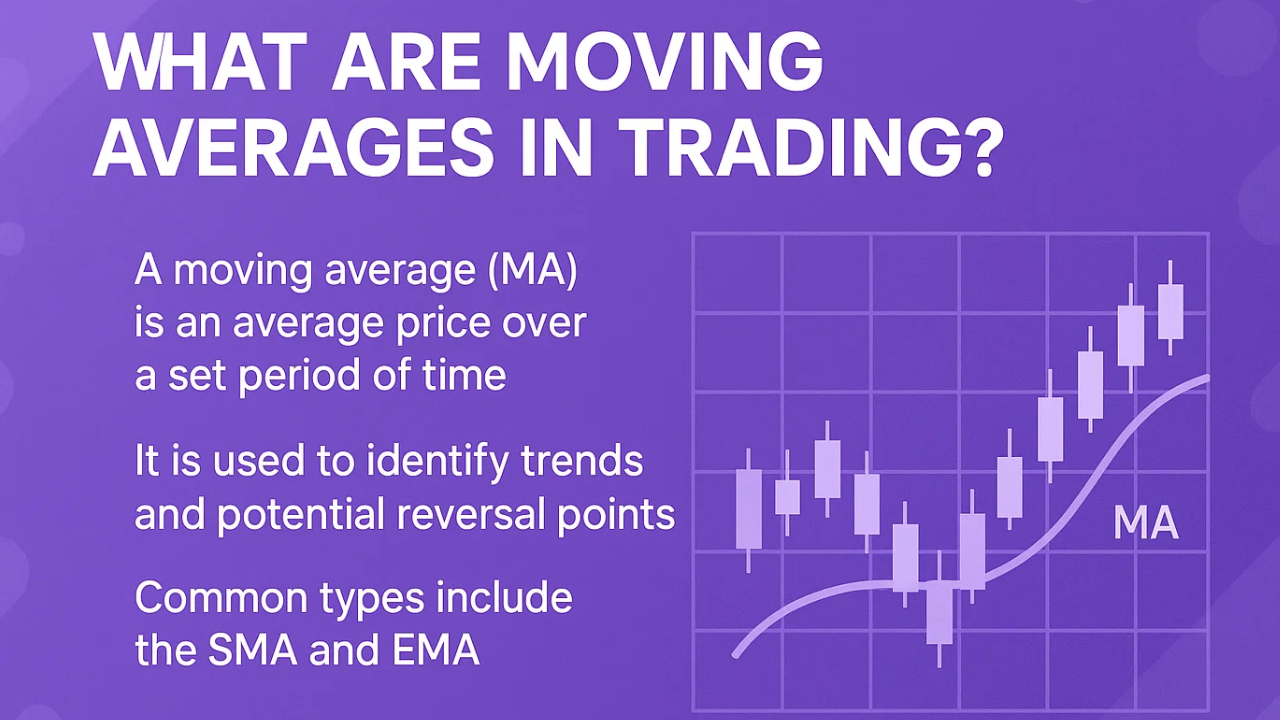
A moving average is a statistical calculation that reduces noise and smooths out price data. Think of it as a way to see the "average" price over a specific period, but one that moves forward with each new candle or bar.
When you look at a price chart, you'll notice that prices move up and down in an erratic fashion. The moving average creates a smooth line that helps you see the underlying trend more clearly.
Every moving average has two main classifications:
Length: The number of periods used to calculate the average
Type: The calculation method (SMA, EMA, HMA, etc.)
For example, when you see "EMA 20," this means:
Type: Exponential Moving Average
Length: 20 periods
The "period" depends on your chart timeframe. On a daily chart, EMA 20 calculates based on 20 days. On a 1-hour chart, it's based on 20 hours.
| Last 5 Prices: | 3, 4, 5, 6, 7 |
| Sum: | 3 + 4 + 5 + 6 + 7 = 25 |
| Periods: | 5 |
| SMA Result: | 25 ÷ 5 = 5 |
See moving averages in action on real charts
Open TradingView → Free account available • No credit card requiredWhile different moving averages use slightly different calculations, they all share the same basic principle: calculating averages of price movements.
Let's look at the Simple Moving Average (SMA) formula:
SMA = (Sum of Closing Prices for N periods) ÷ N
For example, if you have an SMA 5 and the last 5 closing prices were 3, 4, 5, 6, and 7:
SMA = (3 + 4 + 5 + 6 + 7) ÷ 5 = 5
This places the moving average right in the middle of the price range, creating that smooth line you see on charts.
One of the most popular moving average trading strategies involves using them as dynamic support and resistance levels. However, this strategy comes with important nuances that many beginners miss.
Rule 1: Only Use in Clearly Defined Trends
Moving averages work best as support/resistance when there's a clear trend. You can identify trends by looking for:
Higher highs and higher lows (uptrend)
Lower highs and lower lows (downtrend)
Clear directional movement from lower left to upper right (or vice versa)
Rule 2: Never Rely on Moving Averages Alone
To improve your win rate, combine moving averages with other technical analysis tools:
Chart patterns (bull flags, pennants, etc.)
For example, when price pulls back to a moving average AND forms a bull flag pattern, you have two bullish signals confirming your trade.
Here's something crucial that most traders overlook: moving averages can help you identify market equilibrium zones - areas where buying and selling pressure are equal.
When a moving average becomes flat and price oscillates around it, this indicates:
Random price movements
Difficult trading conditions
High probability of false signals
Pro Tip: Avoid using moving averages as support/resistance when they're flat. This is when markets are in equilibrium and trades become more like gambling than strategic decisions.
While sideways markets are challenging, you can still trade them by:
Defining the range boundaries
Trading when price reaches the edges
Using other indicators for confirmation
A moving average breakout occurs when price clearly crosses above or below a moving average. But not all breakouts are created equal.
Ready to trade breakouts with up to 100x leverage?
Trade on Bybit Get $30,000 Bonus Low fees • Multiple deposit options • 24/7 tradingIncreased Momentum: Look for candles at least 2-3 times larger than recent candles
Strong Candle Close: The candle should close well beyond the moving average
Increased Volume: Higher volume confirms more traders agree with the move
Price Action Confirmation: Wait for a second candle to close beyond the MA
During the 2020 market crash, we saw textbook moving average breakouts. The initial breakdown showed all four signs:
Massive momentum candles
Closes far below the moving averages
Spike in volume
Multiple candles confirming the breakdown
Let me share something controversial: I'm not a big fan of the death cross and golden cross signals. Here's why:
Problems with this signal:
Extremely delayed: By the time it triggers, most of the move is over
Many false signals: Often occurs right before reversals
Similar issues:
Signals come too late
Can trigger right before significant pullbacks
These crossover strategies look great in hindsight but often fail in real-time trading. There are much better ways to use moving averages.
HMA 50 (Daily Charts)
Window: 50 | Offset: 0.85
Access these advanced indicators free on TradingView
Get TradingView Pro Tools $15 bonus + 30-day trial with our linkNow let's explore some powerful moving average indicators that can give you an edge:
Developed by Alan Hull, the HMA achieves two seemingly contradictory goals:
Improved responsiveness (reacts faster to price changes)
Enhanced smoothness (less choppy than traditional MAs)
The HMA uses complex calculations but the results are impressive. It can react to trend changes much faster than EMAs or SMAs while maintaining a smooth line.
Best Settings: HMA 50 works well for swing trading on daily charts
Pros:
Extremely responsive to price changes
Very smooth line reduces false signals
Excellent for trend identification
Cons:
Can generate false signals in choppy markets
Requires combination with other indicators
The ALMA uses Gaussian distribution in its calculations, offering unique advantages:
Key Settings:
Window Size: Similar to length (use 50 for comparison with HMA 50)
Offset: Keep at 0.85 (standard)
Sigma: Keep at 6 (standard)
When to Use ALMA vs HMA:
ALMA: Better for breakout trades (fewer false breaks)
HMA: Better for trend identification (more responsive)
Here's how to set up these indicators:
For HMA: Search "Hull" in indicators
For ALMA: Search "ALMA" in indicators
Set length to at least 20-50 for reliable signals
Increase line thickness for better visibility
Many traders don't realize that the MACD (Moving Average Convergence Divergence) is actually built from moving averages:
MACD Line: 12 EMA minus 26 EMA
Signal Line: 9 EMA of the MACD line
Histogram: Distance between MACD and Signal lines
This relationship means the MACD measures momentum through moving average relationships - a powerful concept for timing entries and exits.
Execute your MA strategies with precision
Start on Bybit Up to $30,000 in deposit bonusesBased on extensive testing and real trading experience, here are the key principles for success:
Scalping: Use faster MAs (9-20 periods)
Day Trading: Medium MAs (20-50 periods)
Swing Trading: Slower MAs (50-200 periods)
Use a longer MA for trend direction
Use a shorter MA for entry timing
Confirm with price action
Trending markets: MAs as support/resistance
Ranging markets: Avoid MA strategies
Volatile markets: Use HMA or ALMA for better response
Never risk more than 1-2% per trade
Place stops beyond recent swing points
Use proper position sizing
Using MAs in Isolation: Always combine with other analysis
Ignoring Market Structure: MAs work differently in trends vs ranges
Over-Optimizing Settings: Stick to common periods (20, 50, 100, 200)
Chasing Perfect Signals: No indicator is perfect - manage risk instead
Forgetting About Fundamentals: Major news can override technical signals
For day trading, periods between 20-50 work best. The EMA 20 is popular for quick entries, while the SMA 50 provides reliable support/resistance levels. Consider using multiple timeframes - a 9 EMA for entries and a 50 SMA for trend direction.
EMAs react faster to price changes, making them better for short-term trading and trend changes. SMAs are smoother and better for identifying long-term trends. Many traders use both - EMA for entries and SMA for overall trend direction.
These crossover signals are extremely delayed - by the time they trigger, most of the move is already complete. They also generate many false signals, often occurring right before major reversals. Focus on price action and momentum instead.
The HMA achieves both improved responsiveness and enhanced smoothness through complex calculations. It reacts faster than EMAs while maintaining a smoother line than SMAs. This makes it excellent for trend identification, though it can generate false signals in choppy markets.
Never use moving averages in isolation. Combine them with market structure analysis, volume confirmation, and other technical indicators. Avoid trading when MAs are flat (market equilibrium). Always wait for clear momentum and multiple confirmations before entering trades.
Crypto markets are more volatile, so shorter periods often work better. Try EMA 12 and 26 for quick trades, or HMA 20-30 for better noise reduction. The 50 and 200 SMAs still work well for major support/resistance levels even in crypto.
Moving averages are powerful tools that can significantly enhance your trading when used correctly. From simple support and resistance strategies to advanced indicators like the HMA and ALMA, there's a moving average approach for every trading style and market condition.
The key is to understand not just how these indicators work, but when and why to use them. Remember:
Use moving averages as part of a complete trading system
Match your MA choice to your trading timeframe and style
Always prioritize risk management over perfect signals
Continue learning and adapting as markets evolve
Start with the basics - master the SMA and EMA first. Then gradually explore advanced indicators like the HMA and ALMA as you gain experience. Most importantly, practice with a demo account before risking real capital.
The journey to mastering moving averages is ongoing, but with the knowledge from this guide, you're well-equipped to use them effectively in your trading strategy.
Disclaimer: This content is for educational purposes only and should not be considered financial advice. Trading involves substantial risk of loss. Always conduct your own research and consider your financial situation before making any investment decisions.
Discover the most powerful moving average combinations and optimal settings for different trading styles and market conditions.
Learn how institutional traders use moving averages within Smart Money Concepts for superior market analysis and trade execution.
Combine static support/resistance levels with dynamic moving average levels for more accurate trading decisions.
Deep dive into the MACD indicator - the powerful moving average-based tool for momentum and trend analysis.
Trading & Investing Enthusiast
Teaching traders to understand market psychology, technical analysis, and investing through clear beginner-friendly insights.
Started investing at 16 and became fascinated by how market psychology influences price movements. Still learning something new every day.
Love sharing what I've learned along the way. There's nothing quite like helping someone understand a concept that once confused me too.
Proud to have built a community where traders actively share insights and grow together through daily market analysis and discussion.
Want to join our learning journey?
Unlock HMA, ALMA & pro MA strategies with real-time charts and precision execution