
The Ultimate Order Flow Trading Course: Full Guide 2026
Last Updated: January 1, 2026
🎯 Key Takeaways
-
Order flow trading reveals what happens inside each candlestick by showing the battle between buyers and sellers at every price level, giving you an X-ray view of market activity that traditional charts can't provide.
-
The volume footprint chart displays buying and selling volume at each price level within a candle, allowing you to identify critical patterns like absorption (strong defense) and initiation (aggressive entries) that signal high-probability setups.
-
Cumulative Volume Delta (CVD) tracks the running total of buying versus selling pressure over time, and divergences between CVD and price can provide early warning signals for potential trend reversals.
-
Volume profile shows where trading activity occurred at different price levels, with the Point of Control (highest volume price) often acting as magnetic support or resistance, and low volume nodes indicating areas where price can move quickly.
-
The most effective order flow trading strategy combines volume profile for identifying key zones, footprint charts for precise entry timing, and CVD for confirmation—all within the context of higher timeframe market structure and price action.
If you've ever wondered what's really happening inside each candlestick on your chart, order flow trading might be exactly what you need to take your trading to the next level. While most traders only see the final price result, order flow reveals the actual battle between buyers and sellers that creates each candle.
In this comprehensive guide, I'll walk you through everything you need to know about order flow trading for stocks, crypto, forex, or any other financial market. By the end, you'll understand multiple order flow trading techniques that most traders don't know about.
What is Order Flow Trading?

What is Order Flow Trading?
Order flow trading shows you how candlesticks are actually formed. Think of it as giving your chart an X-ray to see the real activity behind each bar.
Traditional candlestick charts only show you the results—the open, high, low, and close prices. But order flow digs deeper to reveal the cause behind those price movements. When you can understand why a candle formed the way it did, you can make significantly better trading decisions.
Here's what order flow reveals:
The battle between buyers and sellers at each price level
Who controls the market at specific moments
Why price moves in certain directions
The real activity behind each candlestick
It's like having insider information about what's actually happening in the market, not just what the final result looks like.
How Buyers and Sellers Actually Set Price
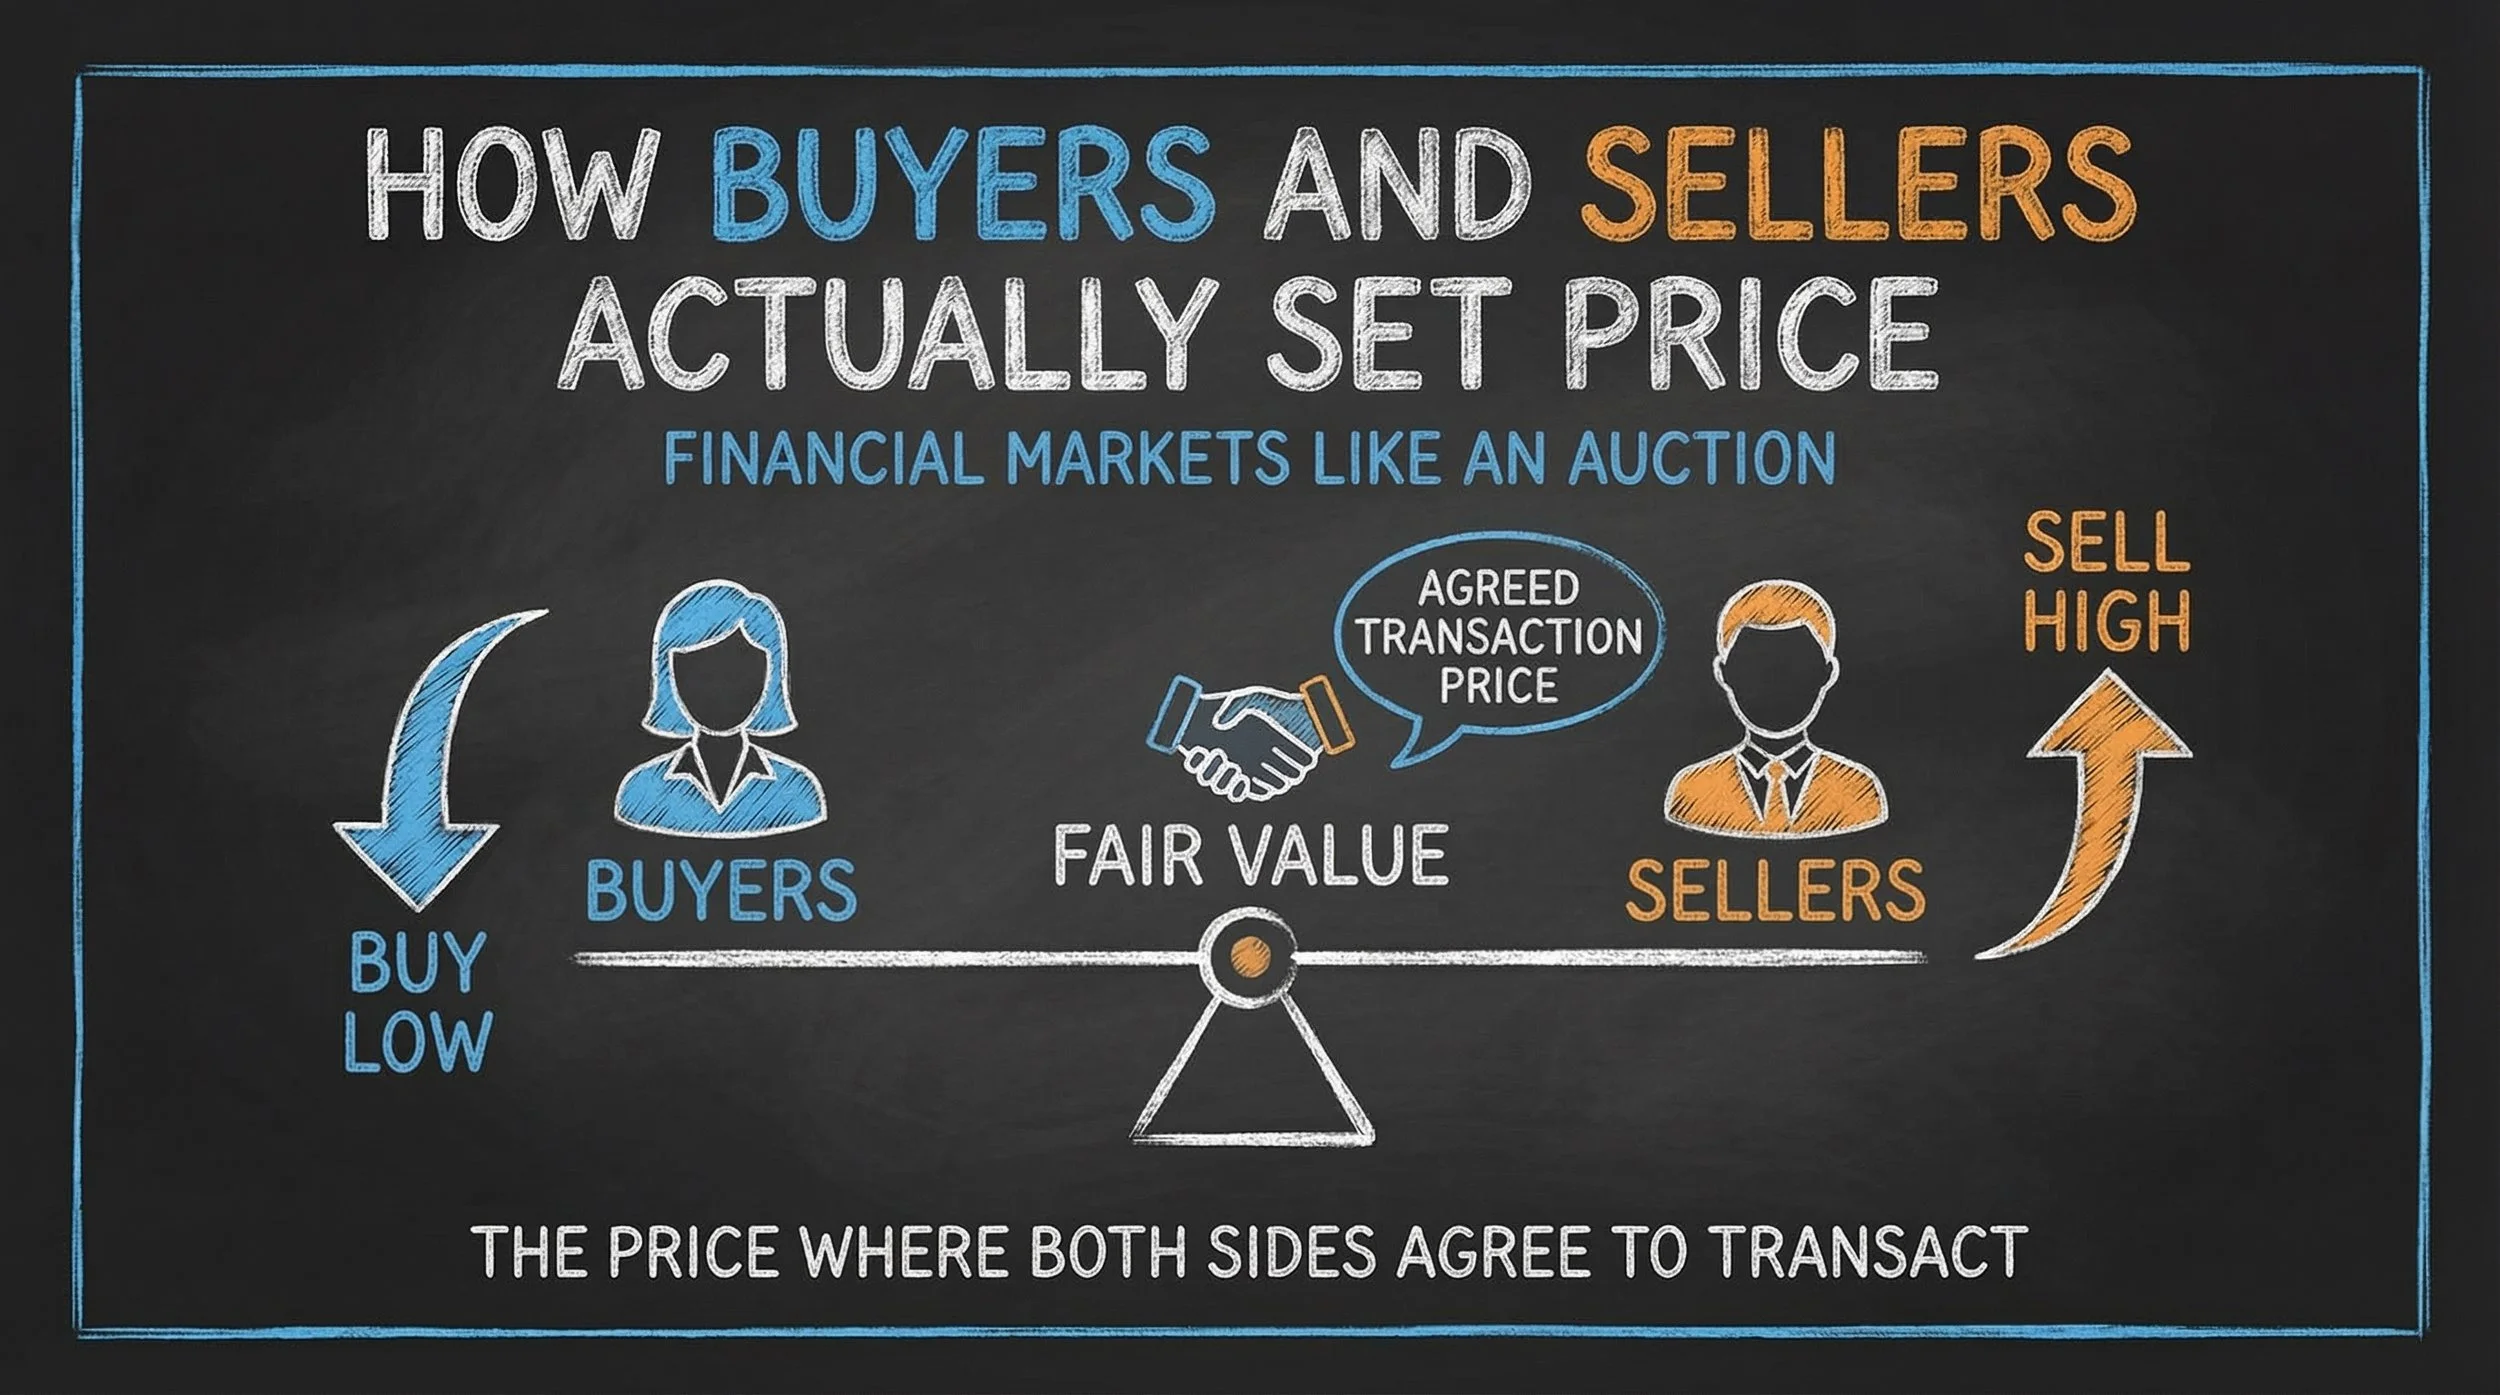
Fair value is the price where buyers and sellers agree to transact—the foundation of order flow trading.
Before diving into order flow tools, you need to understand the fundamental mechanics of how prices are determined in any market—whether that's crypto, stocks, or forex.
Think of all financial markets like auctions where buyers and sellers are constantly negotiating prices. The logic is simple:
Buyers always want to buy as cheap as possible
Sellers always want to sell as high as possible
This is true whether you're buying Bitcoin or groceries—everyone prefers to buy lower and sell higher.
The price where both sides agree to transact is known as fair value. This is one of the most important concepts in order flow trading, and you'll see this term come up repeatedly throughout your trading journey.
Balanced Markets vs Imbalanced Markets
Understanding the difference between balanced and imbalanced markets is crucial for successful order flow trading.
Balanced Markets occur when buyers and sellers agree on prices for an extended period. During these phases:
Price tends to move sideways
Volume builds up at certain levels
You'll see trading ranges or consolidations
Price action looks choppy without clear direction
Imbalanced Markets happen when one side becomes significantly stronger than the other. These create:
Sharp moves in one direction
Strong trends (either up or down)
The money-making opportunities traders seek
Clear directional momentum
I've found that imbalanced markets offer the best trading opportunities because they represent strong conviction from either buyers or sellers. These are the waves you want to catch as a trader, rather than getting chopped up in balanced, sideways markets.
The fair value of any market is simply whatever price is currently trading. When price is at 50,000 for Bitcoin, that's the fair value at that moment because both buyers and sellers agreed to transact there.
The Volume Footprint Chart: Your Market X-Ray
The volume footprint chart is where order flow trading really begins to shine. This tool allows you to see inside individual candlesticks and understand the battle that took place at each price level.
📊 Volume Footprint Quick Reference
Master these 3 patterns to read market battles like a pro
Absorption
Massive volume on one side (🟢 buy or 🔴 sell) but price doesn't break through the level
Strong defense at this price level—the level will likely hold
Initiation
Large volume appearing AS price moves rapidly in one direction
Smart money entering with conviction—major move starting
Delta Divergence
Price moves up ⬆️ but delta is negative (more selling) OR price moves down ⬇️ but delta is positive (more buying)
Move lacks conviction—reversal likely incoming
Candlestick vs Footprint: What's the Difference?
Ready to Read Footprint Charts?
TradingView Premium gives you access to advanced volume footprint indicators, real-time market data, and all the order flow tools you need to trade like a pro.
Plus get $15 bonus credit when you upgrade
What Does a Footprint Chart Show?
A footprint chart displays:
Buy volume (typically in green) at each price level
Sell volume (typically in red) at each price level
The delta between buying and selling pressure
Exactly where transactions occurred within the candle
Instead of just seeing that price went from Point A to Point B, you can see every battle that happened along the way.
Reading the Footprint: Key Patterns
I've identified several powerful patterns you can spot on footprint charts:
Absorption Absorption occurs when one side (buyers or sellers) places massive volume at a specific price level, essentially "absorbing" all the selling or buying pressure. When you see absorption, it often signals that price won't break through that level easily.
For example, if you see massive buying volume appearing at a support level with relatively small selling volume, that's buyers absorbing all the selling pressure—a strong sign that support will hold.
Initiation Initiation is the opposite of absorption. This happens when aggressive orders hit the market and push price rapidly in one direction. You'll see large volume appearing as price moves, indicating strong conviction.
When you spot initiation on a footprint chart, it often signals the start of a significant move. These are the moments when smart money is entering positions with size.
Delta Analysis The delta is simply the difference between buying and selling volume. A positive delta means more buying than selling occurred, while a negative delta indicates more selling pressure.
Here's what I've learned: when price moves up but the delta is negative (meaning more selling than buying), that's a warning sign. It suggests the upward move lacks strong conviction and could reverse.
Cumulative Volume Delta (CVD): The Big Picture
While the footprint chart shows you what's happening inside individual candles, the Cumulative Volume Delta (CVD) indicator shows you who's winning the battle over time.
How CVD Works
CVD takes the delta from each candle (buying volume minus selling volume) and adds them up over time. This creates a cumulative line that shows:
Overall buying or selling pressure across multiple candles
Whether momentum is building or fading
Divergences between price and volume
The Power of CVD Divergences
One of the most valuable applications of CVD is spotting divergences. I've found these to be incredibly reliable signals:
Bullish Divergence Price makes a lower low, but CVD makes a higher low. This suggests that even though price dropped further, selling pressure is actually weakening. Buyers are starting to step in more aggressively.
Bearish Divergence Price makes a higher high, but CVD makes a lower high. This means that despite price pushing higher, buying pressure is diminishing. The rally is losing steam.
These divergences can give you early warning that a trend reversal might be approaching, often before it's obvious on the regular price chart.
Using CVD for Confirmation
I always use CVD as a confirmation tool alongside my other analysis. Here's the general rule:
When price and delta agree (both moving in the same direction), the move is stronger and more reliable
When they diverge, the move is weaker and more likely to reverse
This simple principle has helped me avoid countless bad trades and identify high-probability setups.
Volume Profile: Finding the Battleground Zones
The volume profile is another essential order flow tool that shows you where trading activity occurred at different price levels over a specific time period.
📊 Volume Profile Quick Reference Guide
Master volume profile zones to identify where price will find support, resistance, or move quickly through.
🔥 High Volume Areas (HVA)
Price levels where significant trading occurred
Price Behavior:
- Acts as support/resistance
- Price consolidates when revisited
- Attracts price like a magnet
⭐ Point of Control (POC)
The price level with the highest trading volume (tallest bar)
Price Behavior:
- Strongest support/resistance level
- Price frequently returns to test POC
- Multiple bounces common
⚡ Low Volume Areas (LVA)
Price levels where almost no trading happened
Price Behavior:
- Price moves quickly through zone
- Creates gaps or fast movements
- No consolidation at these levels
📈 Real Bitcoin Example
During a major Bitcoin rally, the POC aligned perfectly with footprint support levels. When Bitcoin later crashed, it bounced three times at this exact POC level—proving how powerful high volume zones are for finding support.
🚀 Ready to Trade Volume Profile?
TradingView gives you advanced volume profile tools, real-time data, and everything you need to identify high-probability trading zones.
30-day free trial + $15 bonus credit included
Understanding Volume Profile Components
A volume profile displays:
Horizontal bars showing how much volume traded at each price
The Point of Control (POC): The price level with the highest volume (tallest bar)
High volume nodes: Price levels where significant trading occurred
Low volume nodes: Price levels where little trading happened
Why Volume Profile Matters
The volume profile helps you identify key levels that will impact future price action:
High Volume Areas (HVA) These are price levels where lots of trading occurred. They tend to act as:
Support and resistance levels
Areas where price might consolidate when revisited
Magnets that attract price back
The Point of Control (POC) is especially significant. I've noticed that price often returns to test the POC, and it frequently acts as either strong support or resistance.
Low Volume Areas (LVA) These are price levels where almost no trading happened. When price enters these zones, it tends to:
Move quickly through the area (since there's no "fair value" established)
Create gaps or fast movements
Avoid consolidating at these levels
Understanding this concept has transformed how I set price targets. When I see a low volume node between current price and my target, I know price can move through that area rapidly.
Volume Profile in Practice
Let me share a real example from recent Bitcoin trading. During a major bullish impulse, I analyzed the volume profile for that entire move. What I discovered:
There was a clear Point of Control at a specific price level
This POC aligned perfectly with where we had found support using the footprint chart
When Bitcoin recently crashed, it bounced exactly at this POC level—not once, but three times
This demonstrates how the volume profile can give you both hints about when price is likely to move fast (through low volume nodes) and where price is likely to find support or resistance (at high volume nodes and the POC).
Setting Up Order Flow Charts on TradingView
To follow along with order flow analysis, you'll need the right tools. I use TradingView for all my technical analysis, and it's the platform I recommend for order flow trading.
Required TradingView Tools
For complete order flow analysis, you'll need access to:
Footprint charts (volume footprint indicator)
CVD indicators (cumulative volume delta)
Volume profile (fixed range and visible range versions)
Most of these tools require TradingView Premium or higher plans. I have a special link that gives you 30 days free to try TradingView Premium, plus a $15 bonus if you decide to continue using it.
Building Your Order Flow Chart
Here's how I set up my charts:
Start with a clean chart using candlesticks or bars
Add the volume footprint indicator to see inside the candles
Overlay the CVD indicator below the main chart
Apply volume profile for the timeframe you're analyzing
Use multiple timeframes to get both the big picture and detailed entry timing
When you first look at a complete order flow chart, it might seem overwhelming. But I promise that if you take the time to understand each component, you'll be able to read these charts fluently.
The Ultimate Order Flow Trading Strategy
Now that you understand all the individual tools, let me show you how to combine them into a powerful trading strategy.
🛠️ Your 5-Minute Order Flow Setup Guide
Follow this simple checklist to get your TradingView charts ready for professional order flow analysis.
📋 What You'll Need
Start with a Clean Chart
Open a new chart using candlesticks or bars. Remove any unnecessary indicators to keep your workspace clear.
Add Volume Footprint
Apply the volume footprint indicator to see buying and selling volume at every price level inside each candle.
Overlay CVD Indicator
Add the Cumulative Volume Delta indicator below your main chart to track buying vs selling pressure over time.
Apply Volume Profile
Enable volume profile (fixed range or visible range) to identify high volume zones and the Point of Control.
Use Multiple Timeframes
Set up additional windows with different timeframes for big picture context and precise entry timing.
🚀 Get Everything You Need for Order Flow Trading
TradingView Premium unlocks all the professional order flow tools mentioned above, plus real-time data across all markets.
Plus get $15 bonus credit when you upgrade
Step 1: Use Volume Profile to Find Key Zones
Start by identifying:
The Point of Control for recent significant moves
High volume nodes that could act as support/resistance
Low volume nodes where price might move quickly
These zones tell you where the major battles occurred and where they're likely to occur again.
Step 2: Use Footprint Charts for Entry Timing
Once you've identified a key zone from the volume profile, zoom into the footprint chart to look for:
Absorption at support/resistance levels (signs of strength)
Initiation when price breaks key levels (signs of commitment)
The exact price levels where significant buying or selling occurred
The footprint gives you precision for your entries and stops.
Step 3: Use CVD for Confirmation
Before entering any trade, check the CVD:
Is the move confirmed by strong delta in the same direction?
Are there divergences suggesting the move might be weakening?
Is buying or selling pressure building or fading?
Never ignore what the CVD is telling you—it's showing the real commitment behind price movements.
Step 4: Combine With Market Structure
This is critical: order flow analysis works best when combined with market structure and price action. I always look at:
Higher timeframe trend direction
Key swing highs and lows
Market structure breaks or confirmations
Support and resistance from traditional technical analysis
Order flow tools tell you what's happening now, but market structure tells you what's likely to happen next.
Example Trade Setup
Let me walk through a complete example:
On the daily chart, I identify an uptrend in Bitcoin
Volume profile shows a POC at $65,000 with high volume
Price pulls back to test this $65,000 level
On the footprint chart, I see massive absorption—big buy volume appearing as price touches $65,000
CVD is rising, showing buyers are in control
I enter long at $65,050 with a stop below the absorption at $64,800
Price rallies strongly from this level, confirming the setup
This is the type of high-probability setup that order flow analysis helps you identify.
Common Order Flow Trading Mistakes to Avoid
Through my experience, I've identified several mistakes that traders commonly make when starting with order flow:
Overcomplicating the Analysis Don't try to use every tool simultaneously when starting out. Master one tool at a time, then gradually combine them.
Ignoring Higher Timeframes Order flow on the 1-minute chart is useless if you're trading against the daily trend. Always start with the bigger picture.
Misreading Delta Remember that a positive delta doesn't guarantee price will go up—it just means more buying than selling occurred. Context matters.
Trading Every Signal Not every absorption or initiation leads to a significant move. Wait for confirmation and proper context before entering trades.
Neglecting Risk Management Order flow analysis can improve your entries, but you still need proper position sizing and stop losses on every trade.
Tips for Practicing Order Flow Analysis
Knowledge alone won't make you profitable. Here's how I recommend practicing order flow trading:
Start With Replay Mode Use TradingView's bar replay feature to practice reading order flow in real market conditions without risking money.
Keep a Trading Journal Document what you see on the footprint, CVD, and volume profile for each setup you analyze or trade.
Focus on One Market First Don't try to master order flow in stocks, crypto, and forex simultaneously. Pick one market and become an expert there first.
Review Your Charts Daily Spend 15-30 minutes each day reviewing order flow patterns, even when you're not trading. Pattern recognition develops through repetition.
Start With Higher Timeframes Order flow is easier to read on 5-minute, 15-minute, or hourly charts when you're learning. The 1-minute chart can be noisy and harder to interpret.
Advanced Order Flow Concepts
Once you've mastered the basics, here are some advanced concepts to explore:
Order Book Analysis The order book (also called depth of market or DOM) shows you pending orders at different price levels in real-time. This can complement your footprint analysis.
Tape Reading Tape reading involves watching the time and sales data to see individual transactions as they occur. This is particularly valuable in fast-moving markets.
Market Profile Market profile is related to volume profile but organizes data into time-price-opportunity structures, offering another perspective on market behavior.
Multi-Timeframe Order Flow Analyzing order flow across multiple timeframes simultaneously gives you both precision and context for better trading decisions.
I plan to create detailed courses on each of these advanced topics, so make sure you're subscribed to stay updated.
FAQ: Frequently Asked Order Flow Trading Questions.
❓ Frequently Asked Questions About Order Flow Trading
While you can access basic TradingView features with a free account, most advanced order flow tools like volume footprint charts, cumulative volume delta (CVD), and comprehensive volume profile indicators typically require TradingView Premium or higher plans. I recommend using the 30-day free trial to test these tools and see if they fit your trading style before committing to a paid plan.
A regular candlestick chart only shows you the open, high, low, and close prices—essentially the final result. A footprint chart reveals what happened inside that candle by displaying the buying and selling volume at each price level. It's like comparing a final exam score (candlestick) to seeing all the individual answers on the test (footprint). The footprint gives you the "why" behind the price movement, not just the "what."
Order flow analysis works across all timeframes and trading styles. While it's popular among day traders and scalpers, swing traders can benefit significantly by using order flow on higher timeframes (like 4-hour or daily charts). The key is adjusting your analysis to match your trading timeframe—daily volume footprints for swing trades and 5-minute footprints for day trades. The principles remain the same regardless of your trading style.
The Point of Control is the price level with the highest traded volume in a given period—represented by the tallest bar on a volume profile. It's important because it shows where the most "fair value" trading occurred, making it a strong reference point for future price action. The POC often acts as a magnet, drawing price back to that level, and frequently serves as significant support or resistance. When price returns to test the POC, it's a high-probability area to watch for trading opportunities.
Absorption appears when you see large volume on one side (buying or selling) at a specific price level, but price doesn't move through that level. For example, if massive selling volume hits a support level but price doesn't break down—and you see strong buying volume appearing—that's buyers "absorbing" all the selling pressure. Look for imbalanced volume where one side is significantly larger, yet price holds. This pattern often signals that the level will hold and price may reverse direction.
A CVD divergence occurs when price and cumulative volume delta move in opposite directions, revealing a weakening trend. For example, if price makes a higher high but CVD makes a lower high, it means buying pressure is decreasing despite price pushing higher—a bearish signal. Conversely, if price makes a lower low but CVD makes a higher low, selling pressure is weakening even as price drops—a bullish signal. These divergences often provide early warning that a trend reversal may be approaching, giving you time to adjust your positions or prepare for counter-trend trades.
QUIZ: Test Your Order Flow Trading Knowledge
📊 Test Your Order Flow Trading Knowledge
See how well you understood the key concepts from this guide. Take this quick quiz to test your knowledge!
Question 1 of 5
What does order flow trading reveal that traditional candlestick charts don't show?
Conclusion: Your Order Flow Trading Journey Starts Now
Congratulations on making it through this comprehensive guide to order flow trading! You now understand concepts that 99% of traders don't know about—volume footprints, cumulative volume delta, and volume profiles.
But here's the truth: reading this article is just the beginning. To truly benefit from order flow analysis, you need to practice what you've learned. Open up your charts, add these indicators, and start observing how buyers and sellers battle at different price levels.
Start by watching how footprint charts reveal the real action inside candlesticks. Notice when absorption appears at key levels and what happens afterward. Track how CVD divergences predict reversals. Study where the volume profile's Point of Control acts as support or resistance.
The beauty of order flow trading is that it works across all markets and timeframes. Whether you're day trading crypto, swing trading stocks, or scalping forex, these principles remain the same.
Ready to Take the Next Step?
To use order flow effectively, you also need to understand market structure and price action. I've created comprehensive video courses on both topics that complement this order flow guide perfectly. You can find links to these courses in the description below.
For those who want to dive even deeper, I share exclusive order flow analysis, custom indicators, and bonus content with our YouTube channel members. As a member, you'll get priority replies to your questions, access to private videos, and downloadable resources to help you master order flow trading.
Remember: The markets are constantly showing you who's in control through order flow. Most traders ignore these signals and rely only on price charts. By understanding order flow, you're seeing what they're missing—and that's a significant edge in your trading.
Start practicing today, and don't hesitate to revisit this guide as you develop your skills. Order flow analysis is a journey, not a destination. Every chart you analyze will teach you something new about how markets really work.
Happy trading, and I'll see you in the markets!
Disclaimer: This content is for educational purposes only and should not be considered financial advice. Trading involves substantial risk of loss. Always conduct your own research and consider your financial situation before making any investment decisions.
Want to join our learning journey?