
The Ultimate Candlestick Pattern Trading Guide: Master 15 Powerful Formations
Learn to identify and trade the most reliable candlestick patterns that complement your Heikin-Ashi analysis.
Are you a visual learner? Don't worry, in this YouTube video, you will learn everything you need to know about Heikin-Ashi trading... From the very basics to advanced strategies, including my two-chart setup, reading doji signals, and a complete step-by-step trading strategy you can use today.
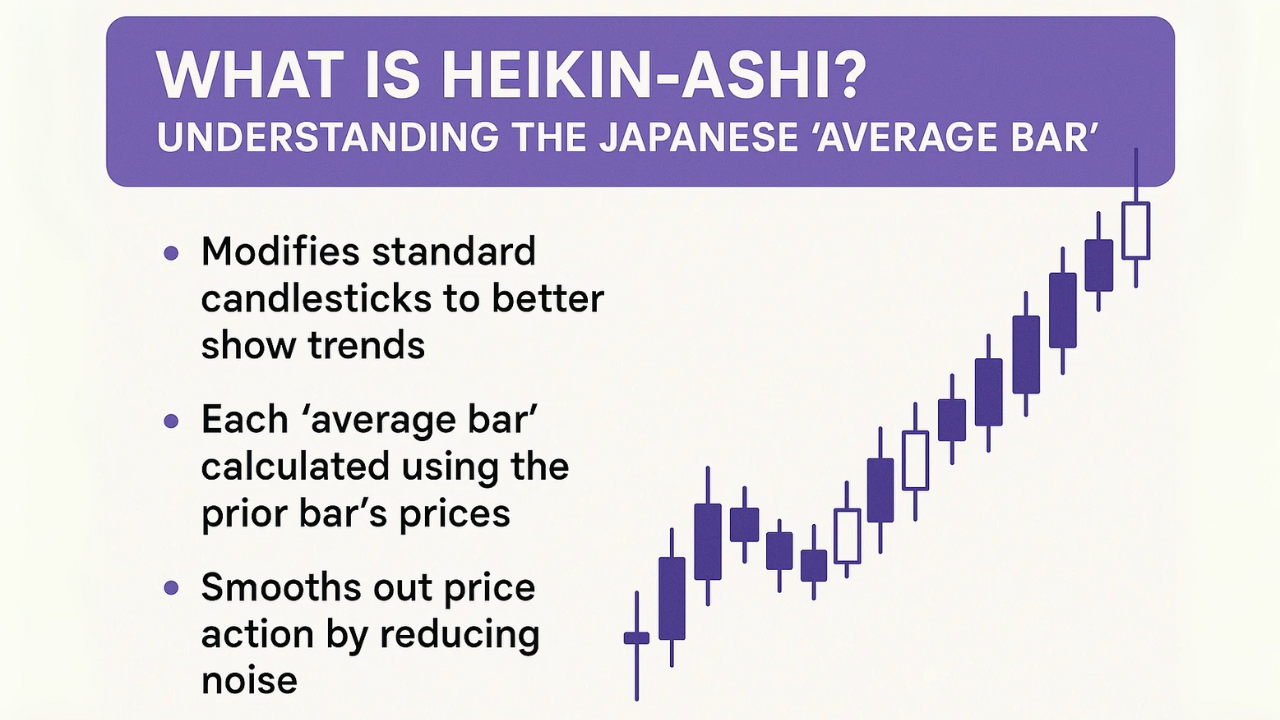
Heikin-Ashi is a Japanese charting technique that averages price data to create smoother, trend-revealing charts by filtering out market noise
Each Heikin-Ashi candle opens at the midpoint of the previous candle, creating the characteristic smooth appearance and clear trend visualization
Strong trends show consecutive same-colored candles with no wicks on one side - no lower wicks in uptrends, no upper wicks in downtrends
A two-chart setup combining Heikin-Ashi with regular candlesticks provides both trend clarity and accurate price data for optimal trading decisions
Doji candles at key support/resistance levels combined with market structure analysis can provide high-probability entry signals for trend reversals
Most traders completely miss massive market moves because they're overwhelmed by the noise in regular candlestick charts. But what if there was a charting technique that could smooth out the chaos and reveal crystal-clear trends? Enter Heikin-Ashi charts – a powerful Japanese charting method that can transform how you see and trade the markets.
Today, I'll show you exactly how to read and understand Heikin-Ashi charts, share my special two-chart setup, and reveal a proven Heikin-Ashi trading strategy you can start using immediately to identify high-probability trades.
What are Heikin Ashi Candles?
Before we dive into trading strategies, let's understand what makes Heikin-Ashi charts special. The term "Heikin-Ashi" literally translates to "average bar" in Japanese – and that's exactly what these charts do. They average price data to create a smoother, more readable chart that filters out market noise.
Here's a fun fact: Both regular candlesticks and Heikin-Ashi charts originated in Japan. The Japanese were pioneers in technical analysis development, giving us these powerful tools that traders worldwide use today.
The primary goal of Heikin-Ashi charts is simple: Cut through the noise of normal candles so you can see trends more clearly. This works across any market – stocks, forex, crypto, commodities – and any timeframe. However, I've found they work best in markets with high liquidity.
While you don't need to memorize complex formulas, understanding the basic logic helps you use these charts effectively. Here's how Heikin-Ashi candles differ from regular candles:
Regular Candle Components:
Open: The price at period start
High: The highest price during the period
Low: The lowest price during the period
Close: The price at period end
Heikin-Ashi Candle Components:
Close: The average of Open, High, Low, and Close (OHLC)
Open: The midpoint of the previous Heikin-Ashi candle
High: The maximum price reached (same as regular candle)
Low: The minimum price reached (same as regular candle)
In simple terms, Heikin-Ashi blends current price data with the previous candle to create a smoother chart. This is why you'll see more beautiful trends and cleaner pullbacks on Heikin-Ashi charts.
Let me show you the most important characteristic of Heikin-Ashi candles that makes them so powerful for trend identification.
When you look at a Heikin-Ashi chart, you'll notice something fascinating: each candle opens at the exact midpoint of the previous candle. This creates a smooth, connected flow between candles that's visually striking.
For example:
If the previous candle ranges from $100 to $110, the next candle opens at $105
This happens regardless of where the actual market price is
Even doji candles (which are crucial in Heikin-Ashi analysis) follow this rule
This midpoint opening is a major reason why Heikin-Ashi charts look so smooth and why trends appear more clearly defined.
Here's what sets Heikin-Ashi apart from traditional candlesticks:
Data Representation
Normal candles: Show raw, real-time price data
Heikin-Ashi: Shows averaged, smoothed price data
Trend Visualization
Normal candles: Mixed colors even in strong trends
Heikin-Ashi: Consecutive same-colored candles during trends
Wick Patterns
Strong uptrends: Green candles often have no lower wicks
Strong downtrends: Red candles often have no upper wicks
Price Accuracy
Normal candles: Display exact market prices
Heikin-Ashi: Display averaged prices (not exact)
Transform your trading with the professional dual-chart approach that reveals both trends AND precise prices
Unlock the full power of dual-chart trading with TradingView Premium
Get Premium Access 30-day free trial + $15 bonus includedThrough years of trading, I've discovered that the most effective way to use Heikin-Ashi is with a dual-chart setup. This approach gives you the best of both worlds: trend clarity from Heikin-Ashi and precise price data from regular candles.
Here's my step-by-step process for creating the perfect Heikin-Ashi setup:
Access Chart Type Settings
Click on the "Candles" dropdown in your chart
Scroll down to find "Heikin-Ashi"
Select it to transform your chart
Configure Heikin-Ashi Settings
Right-click on the chart and select "Settings"
Optional: Enable "Real prices on price scale" for reference
Adjust visual settings to your preference
Create the Two-Chart Layout
Go to the layout settings (you'll need TradingView Premium for this)
Select the two-chart side-by-side layout
Set one chart to Heikin-Ashi, the other to regular candles
Ensure both charts show the same instrument and timeframe
This dual setup solves Heikin-Ashi's main limitation – the lack of real price data. When I spot a signal on the Heikin-Ashi chart, I immediately check the regular candlestick chart for:
Exact entry and exit prices
Confirmation patterns
Precise support and resistance levels
Real-time price action
Understanding Heikin-Ashi signals is crucial for successful trading. Here are the key patterns I look for:
Bullish Trend Indicators:
Multiple green candles with no lower wicks
Consistently higher closes
Minimal upper shadows
No color changes for extended periods
Bearish Trend Indicators:
Multiple red candles with no upper wicks
Consistently lower closes
Minimal lower shadows
Sustained red color sequences
Doji Candles in Heikin-Ashi: Doji candles (small bodies with wicks on both sides) are especially significant in Heikin-Ashi charts. They indicate:
Market indecision
Potential trend exhaustion
Possible reversal points
Spinning Tops: Similar to dojis but with slightly larger bodies, these suggest:
Weakening trend momentum
Balance between buyers and sellers
Time to tighten stops or consider exits
One of my favorite Heikin-Ashi techniques involves watching the wicks:
No lower wicks in uptrend = Strong bullish momentum
No upper wicks in downtrend = Strong bearish momentum
Wicks appearing on both sides = Trend weakness developing
Instantly spot trends and stay in winners longer
Stocks, Forex, Crypto, Commodities - all timeframes
Reduces panic exits and overreactions
Simple signals for trend-following success
Confirms moves rather than predicts (not always bad!)
Always check actual prices before trading
Gaps and some candlestick patterns disappear
Less effective in sideways, ranging conditions
Trade crypto with up to 100x leverage on Bybit's advanced platform
Start Trading Now Get up to $30,000 in deposit bonusesWhile many YouTube videos only highlight the benefits, I believe in giving you the complete picture. Let's examine both sides:
Trend Clarity
Makes trends incredibly easy to identify
Filters out minor price fluctuations
Helps you stay in winning trades longer
Universal Application
Works across all markets: stocks, forex, crypto, commodities, ETFs
Effective on multiple timeframes
Consistent signals regardless of market
Emotional Control
Reduces overreaction to minor pullbacks
Helps maintain discipline during trends
Minimizes false exit signals
Visual Simplicity
Clean, easy-to-read charts
Clear entry and exit signals
Perfect for trend-following strategies
Price Lag This is crucial – Heikin-Ashi is technically a lagging chart type. However, like my favorite MACD indicator, being "lagging" doesn't mean it's ineffective. It simply means you're trading confirmed moves rather than trying to predict them.
Inaccurate Price Display Heikin-Ashi doesn't show exact market prices. This is why I always use my two-chart setup for precise entries and exits.
Missing Technical Patterns Some important patterns become invisible:
Price gaps don't appear
Certain candlestick patterns are obscured
Exact support/resistance levels are harder to identify
Poor Performance in Ranging Markets In sideways, choppy markets, Heikin-Ashi can actually make charts harder to read and generate false signals.
Now let's put everything together into a actionable trading strategy. I combine Heikin-Ashi with market structure analysis for high-probability trades.
This strategy leverages Heikin-Ashi's trend-identification strength with key support and resistance levels for optimal entries.
Before looking at Heikin-Ashi signals, I always:
Mark major support and resistance levels
Identify previous significant highs and lows
Note any levels that have been tested multiple times
At these key levels, watch for:
Doji candles appearing after a trend
First color change after extended moves
Wicks appearing where they previously didn't exist
Switch to your regular candlestick chart to find:
Bullish/bearish engulfing patterns
Pin bars or rejection candles
Other reversal candlestick patterns
Entry: Use prices from the regular candlestick chart Stop Loss: Place below support (for longs) or above resistance (for shorts) Take Profit: Use either:
Fixed risk-reward ratio (I prefer 1:2 minimum)
Trail using Heikin-Ashi color changes
Let me walk you through a recent gold trade using this exact strategy:
Structure: Identified significant support at a previous low that had acted as both support and resistance multiple times
Signal: Spotted a Heikin-Ashi doji right at this support level
Confirmation: Regular chart showed a bullish engulfing pattern
Execution: Entered long with stop below support, targeting 2:1 risk-reward
Result: Trade hit target as momentum continued
Some traders prefer riding trends using Heikin-Ashi signals:
Method 1: Exit when wickless candles end
Method 2: Exit on first opposite color candle
Method 3: Use a combination of both for partial profits
Combine Heikin-Ashi with institutional insights. InvestingPro's AI reveals where big players are positioning across 150,000+ assets.
Get AI Insights Save 70% + access professional-grade analysisAfter years of using Heikin-Ashi charts, here are my top recommendations:
Heikin-Ashi works best in liquid markets. Avoid using it on:
Low-volume stocks
Exotic currency pairs
Illiquid cryptocurrency pairs
Never rely solely on Heikin-Ashi. I always incorporate:
Support and resistance levels
Volume analysis
Overall market conditions
Fundamental catalysts
Spend time studying how Heikin-Ashi behaves during:
Strong trends
Reversals
Consolidations
News events
Always use stop losses
Size positions according to your risk tolerance
Don't chase extended moves
Be patient for high-probability setups
Learning from others' mistakes can save you money. Here are the most common errors I see:
Never place orders based on Heikin-Ashi prices – they're not real! Always check actual market prices before entering trades.
Heikin-Ashi signals work best within broader market context. A doji in the middle of nowhere means less than one at a key level.
Not every color change is a trading signal. Look for confluence with other factors before acting.
When markets are ranging, switch to other analysis methods. Heikin-Ashi excels in trends, not consolidations.
Once you've mastered the basics, consider these advanced applications:
Use Heikin-Ashi on higher timeframes for trend direction, then drop to lower timeframes for entry timing.
Watch for divergences between Heikin-Ashi trends and momentum indicators like RSI or MACD.
Combine Heikin-Ashi signals with volume analysis for stronger trade confirmation.
Some traders code Heikin-Ashi rules into automated systems, though this requires careful backtesting.
Heikin-Ashi works effectively across all timeframes, including for day trading. The key requirement is sufficient market liquidity. For day trading, use it on liquid instruments like major forex pairs, popular stocks, or high-volume cryptocurrencies. Just remember to always check real prices on regular candlestick charts before entering trades, as Heikin-Ashi displays averaged prices.
Heikin-Ashi uses averaged price calculations rather than raw market data. The close is calculated as the average of open, high, low, and close (OHLC), while the open is the midpoint of the previous Heikin-Ashi candle. This averaging process creates the smooth appearance but means the displayed prices aren't the actual market prices you'd trade at.
Always use regular candlestick charts to set your stop losses, not Heikin-Ashi prices. Place stops based on actual support/resistance levels visible on the regular chart. A common approach is to set stops just below support for long trades or above resistance for short trades, using the real price levels from standard candlesticks.
While you can use basic Heikin-Ashi charts with a free TradingView account, the premium version allows you to use the two-chart layout I recommend, which displays both Heikin-Ashi and regular candlesticks simultaneously. This dual setup significantly improves trading accuracy and is worth the investment for serious traders.
Heikin-Ashi performs best in trending, liquid markets. Look for instruments with consistent daily volume, clear directional moves, and minimal gaps. Major forex pairs, large-cap stocks, popular commodities like gold and oil, and high-volume cryptocurrencies typically work well. Avoid penny stocks, exotic currency pairs, or any market with sporadic trading volume.
While Heikin-Ashi is powerful for trend identification, combining it with other tools enhances accuracy. I recommend using it with support/resistance levels, volume indicators, and momentum oscillators like MACD or RSI. This multi-factor approach helps confirm signals and avoid false entries, especially during ranging markets where Heikin-Ashi is less effective.
Heikin-Ashi charts offer a powerful way to identify and trade trends with greater clarity and confidence. By smoothing out market noise and highlighting sustained price movements, they can help you stay in winning trades longer and avoid premature exits.
Remember, successful Heikin-Ashi trading requires:
Understanding both advantages and limitations
Using the two-chart setup for accurate pricing
Combining signals with market structure analysis
Practicing proper risk management
Start by setting up your Heikin-Ashi charts in TradingView (grab your free 30-day premium trial with my link for the dual-chart layout), practice identifying the key patterns, and always confirm signals with regular candlesticks before executing trades.
The beauty of Heikin-Ashi lies not in predicting the future, but in clearly showing you what's happening right now. Master this tool, and you'll see markets with new clarity.
Ready to take your trading to the next level? Check out my comprehensive price action course where I dive even deeper into advanced trading techniques that complement Heikin-Ashi analysis perfectly.
Disclaimer: This content is for educational purposes only and should not be considered financial advice. Trading involves substantial risk of loss. Always conduct your own research and consider your financial situation before making any investment decisions.
Learn to identify and trade the most reliable candlestick patterns that complement your Heikin-Ashi analysis.
Discover advanced price action techniques that work perfectly with Heikin-Ashi trend identification.
Explore other smoothing indicators that pair well with Heikin-Ashi for confirmed trend signals.
Learn to identify key levels that enhance your Heikin-Ashi reversal signals for higher probability trades.
Trading & Investing Enthusiast
Teaching traders to understand market psychology, technical analysis, and investing through clear beginner-friendly insights.
Started investing at 16 and became fascinated by how market psychology influences price movements. Still learning something new every day.
Love sharing what I've learned along the way. There's nothing quite like helping someone understand a concept that once confused me too.
Proud to have built a community where traders actively share insights and grow together through daily market analysis and discussion.
Want to join our learning journey?
Set up the perfect dual-chart system for crystal-clear trend signals