
How to Draw Fibonacci Retracement Correctly in TradingView
Perfect your Fibonacci drawing technique with this step-by-step visual guide for accurate level placement.
If you prefer video over reading, you are at the perfect place. In this YouTube video, you will learn all about fibonacci crypto trading, from how to set it up on tradingview to practice trading strategies. I'll reveal the exact golden zone settings (0.5-0.618), show you how to draw Fibonacci correctly, and walk through a complete trade example with entries, stops, and targets. Perfect for any timeframe or market.
The "golden zone" between 0.5 and 0.618 Fibonacci levels is the most reliable retracement area for finding high-probability trade entries in trending markets
Always combine Fibonacci retracement levels with price action signals like bullish engulfing patterns for confirmation before entering trades
Simplify your Fibonacci settings by focusing only on key levels (0, 0.5, 0.618, 1) to avoid analysis paralysis and improve decision-making
Draw Fibonacci retracements only on significant swing points that are clearly visible on your chart for the most reliable results
This Fibonacci strategy works across all markets and timeframes, from 1-minute crypto charts to daily forex and stock trading
Stop drawing your Fibonacci levels randomly on your charts. After years of trading and testing, I've discovered that there are specific Fibonacci settings and levels that consistently deliver results – and most traders are completely missing them. In this comprehensive guide, I'll show you exactly how to use the Fibonacci retracement strategy the right way, including the "golden zone" that has caught every major Bitcoin pullback.
The Fibonacci trading strategy is one of the most misunderstood tools in technical analysis. While countless traders attempt to use Fibonacci retracement levels, few understand the specific settings and zones that actually produce consistent results. Through extensive backtesting and real-world application, I've refined a Fibonacci strategy that focuses on what I call the "golden zone" – a specific area between the 0.5 and 0.618 retracement levels that acts as a magnet for price during pullbacks.
What makes this approach different is its simplicity and repeatability. Instead of cluttering your charts with every possible Fibonacci level, we'll focus on the zones that matter most. When combined with proper price action signals, this Fibonacci trading strategy can help identify high-probability entry points in trending markets.
Fibonacci Retracement Levels Explained
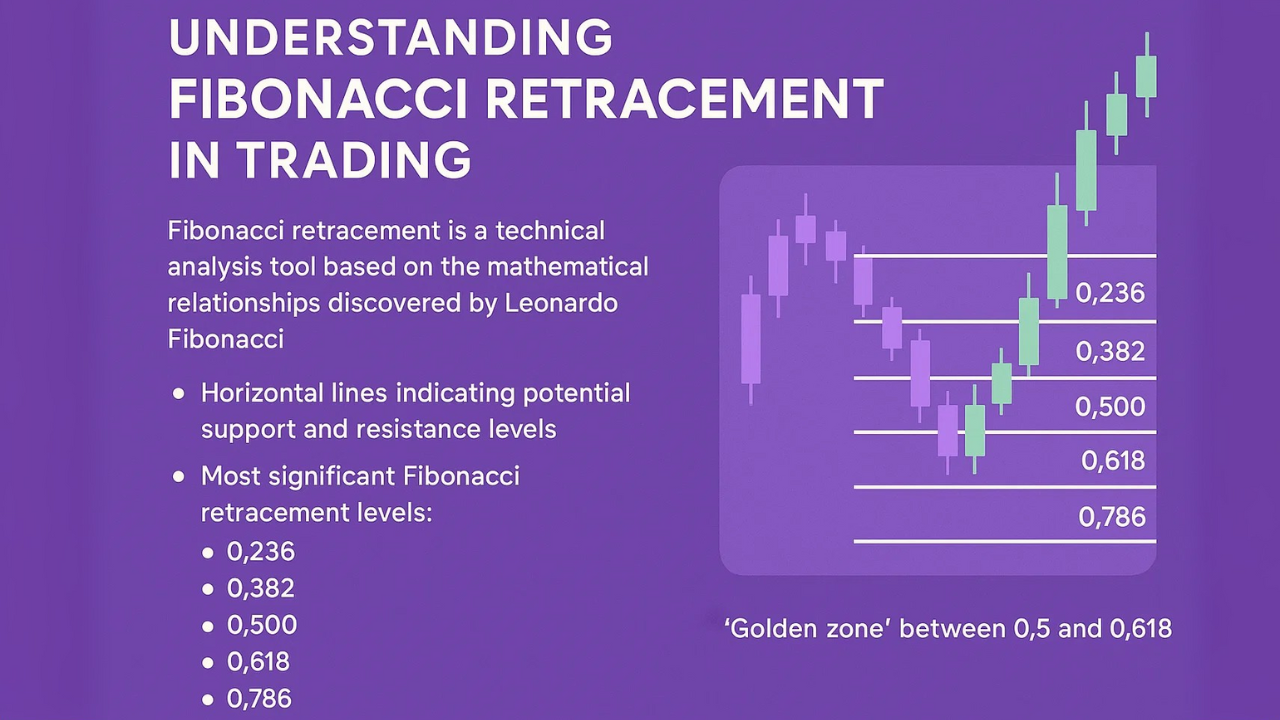
Fibonacci retracement is a technical analysis tool based on the mathematical relationships discovered by Leonardo Fibonacci. In trading, these ratios translate into horizontal lines that indicate potential support and resistance levels during market pullbacks. The most significant Fibonacci retracement levels are:
0.236 (23.6%)
0.382 (38.2%)
0.500 (50%)
0.618 (61.8%)
0.786 (78.6%)
However, not all levels are created equal. Through years of analysis, I've found that the zone between 0.382 and 0.618 consistently provides the most reliable trading opportunities, with the "golden zone" between 0.5 and 0.618 being particularly powerful.
The beauty of Fibonacci retracement lies in its versatility – it works across all timeframes and markets. Whether you're analyzing crypto on the daily chart or forex on the 5-minute timeframe, these mathematical relationships remain constant. The key is knowing which levels to focus on and how to combine them with other technical signals.
The area between 0.5 and 0.618 Fibonacci retracement levels - a powerful price magnet during pullbacks in trending markets.
This zone represents the perfect balance: deep enough to shake out weak hands, shallow enough to maintain the trend structure. I've observed this phenomenon consistently across all markets and timeframes.
Wait for price to enter the golden zone, then look for price action confirmation signals. This combination creates a robust strategy that can significantly improve your entry timing.
Ready to find golden zone opportunities in real-time?
Get TradingView Free 30-day trial + $15 bonus • Advanced Fibonacci tools includedThe golden zone is the area between the 0.5 and 0.618 Fibonacci retracement levels. This zone acts as a powerful magnet for price during pullbacks in trending markets. Why does this zone work so well? It represents the perfect balance between a meaningful pullback that shakes out weak hands while maintaining the overall trend structure.
When price retraces to this golden zone, it often finds support (in uptrends) or resistance (in downtrends) before continuing in the direction of the primary trend. This phenomenon isn't just theory – I've observed it countless times across different markets and timeframes.
The most effective approach is to wait for price to enter the golden zone and then look for confirmation through price action signals. This combination of Fibonacci levels with price action creates a robust trading strategy that can significantly improve your entry timing.
Let me show you a powerful example using Bitcoin's previous bull run. This case study perfectly illustrates how consistently the golden zone worked during one of crypto's most explosive moves.
Starting from a significant swing low, we draw our Fibonacci retracement to the next major swing high. What happened next was remarkable – every single major pullback during that bull run bounced precisely within the golden zone. This wasn't a coincidence; it was the market respecting these mathematical levels.
Here's what I observed:
First pullback: Price retraced to the golden zone and bounced aggressively
Second pullback: Again, support was found right at the 0.618 level
Third pullback: The pattern repeated, with buyers stepping in at the golden zone
This consistency across multiple pullbacks demonstrates the reliability of this Fibonacci strategy when applied correctly. The key was patience – waiting for price to reach the golden zone rather than trying to catch a falling knife at random levels.
Master the exact steps to configure Fibonacci retracement for the golden zone strategy
Navigate to the Gann and Fibonacci tools menu in the left toolbar
Choose "Fib Retracement" from the dropdown menu
Click on a swing low and drag to a swing high (for uptrends)
Remove unnecessary levels to focus on the golden zone (0.5-0.618)
Ready to implement this strategy with professional tools?
Try TradingView Free Advanced charting features • 30-day trial • $15 bonusNow let me walk you through exactly how to set up the Fibonacci indicator on TradingView for optimal results. First, open a clean chart in TradingView. If you don't have TradingView Premium yet, I recommend trying it out – the advanced charting features are invaluable for serious traders.
To add the Fibonacci retracement tool:
Navigate to the Gann and Fibonacci tools menu
Select "Fib Retracement"
Click on a swing low and drag to a swing high (for uptrends)
The indicator will automatically plot all standard Fibonacci levels
The default settings include multiple levels, but for our golden zone strategy, we want to simplify. This focused approach prevents analysis paralysis and keeps your attention on the levels that truly matter.
Here's where most traders go wrong – they keep all the default Fibonacci levels, creating a cluttered mess on their charts. Let me show you the optimal Fibonacci settings for this strategy.
To customize your Fibonacci indicator:
Double-click on the Fibonacci tool to open settings
Navigate to the "Style" tab
Uncheck all levels except: 0, 0.5, 0.618, and 1
Change the 0 and 1 levels to gray (these are just reference points)
Set the 0.5 and 0.618 levels to gold or yellow (highlighting our golden zone)
This clean setup immediately draws your eye to the golden zone, making it easy to spot when price enters this crucial area. The visual clarity this provides cannot be overstated – you'll instantly know when a potential trading opportunity is developing.
Step-by-step execution guide for real market conditions
Result: Using a 2:1 risk-reward ratio can capture significant portions of trending moves. The key is maintaining discipline and sticking to your plan.
Execute this strategy with lightning-fast fills and deep liquidity
Trade on Bybit Claim up to $30,000 in bonuses • Professional trading platformLet me walk you through a complete trade setup using the golden zone Fibonacci strategy. This example will show you exactly how to execute this strategy in real market conditions.
The Setup:
Identify a clear uptrend with defined swing points
Draw Fibonacci from swing low to swing high
Wait for price to retrace into the golden zone (0.5-0.618)
Look for a bullish price action signal (like a bullish engulfing pattern)
Entry Rules:
Enter at the close of the confirmation candle
This ensures the price action signal is complete
Avoid entering before confirmation – patience is crucial
Stop Loss Placement:
Place your stop loss below the low of the pattern
This gives the trade room to breathe while protecting capital
For the golden zone, this typically provides an excellent risk-reward ratio
Profit Targets:
Initial target: Previous swing high (1:1 risk-reward minimum)
Extended target: 2:1 or 3:1 risk-reward ratio
Consider trailing your stop once price moves in your favor
In my example trade, using a 2:1 risk-reward ratio would have captured a significant portion of the continued uptrend. The key is maintaining discipline and not deviating from the plan once you're in the trade.
The Fibonacci retracement strategy becomes exponentially more powerful when combined with price action analysis. Price action provides the confirmation signal that transforms a potential level into an actual trading opportunity.
Key price action signals to watch for at Fibonacci levels:
Bullish Engulfing: A strong reversal pattern when it occurs at the golden zone
Pin Bars/Hammers: Show rejection of lower prices at key Fibonacci levels
Inside Bars: Indicate consolidation before continuation
Morning/Evening Stars: Complex reversal patterns that align perfectly with Fibonacci zones
The combination works because Fibonacci provides the "where" (location) while price action provides the "when" (timing). This dual confirmation significantly increases the probability of successful trades.
I've found that waiting for clear price action signals at Fibonacci levels filters out many false signals. Yes, you might miss some moves, but the trades you do take will have a much higher success rate.
Through teaching and mentoring traders, I've identified several common mistakes that sabotage Fibonacci trading success:
1. Drawing Fibonacci on Minor Swings Only use significant swing points that are clearly visible on your chart. Minor swings produce unreliable levels.
2. Ignoring the Trend Fibonacci retracements work best in trending markets. In ranging markets, the levels become less reliable.
3. Not Waiting for Confirmation Entering immediately when price touches a Fibonacci level is gambling. Always wait for price action confirmation.
4. Using Too Many Levels More lines don't mean better analysis. Focus on the golden zone and maybe one additional level at most.
5. Setting Stops Too Tight Give your trades room to work. Fibonacci levels are zones, not exact prices.
While I demonstrated this Fibonacci strategy using Bitcoin, it works across all liquid markets. Here's how to adapt it:
Forex Trading:
Focus on major pairs for best results
The golden zone works exceptionally well during trend continuations
Combine with fundamental analysis for major economic events
Stock Trading:
Works best with trending stocks
Particularly effective on daily and weekly timeframes
Consider volume confirmation at Fibonacci levels
Cryptocurrency:
Extreme volatility makes the golden zone even more relevant
Works on all timeframes due to 24/7 trading
Multiple tests of the golden zone are common in crypto
The principles remain the same – identify the trend, wait for a golden zone retracement, and confirm with price action. The beauty of this strategy is its universal application.
Protect your capital while maximizing golden zone opportunities
Remember: Even the best Fibonacci strategy won't win every trade. The goal is consistent profitability over time through disciplined risk management.
Apply these risk management rules with confidence on the world's largest exchange
Trade on Binance Save 10% on all trading fees • Advanced order types for risk managementNo trading strategy is complete without proper risk management. Here's how to protect your capital while using the Fibonacci retracement strategy:
Position Sizing:
Never risk more than 1-2% of your account per trade
The golden zone often provides excellent risk-reward ratios
Calculate position size based on stop loss distance
Stop Loss Rules:
Always use a stop loss – no exceptions
Place stops beyond the price action signal's extreme
Consider the 0.786 level as an ultimate stop for golden zone trades
Trade Management:
Move stop to breakeven once price reaches 1:1 risk-reward
Consider partial profits at key resistance levels
Trail stops using market structure or a moving average
Remember, even the best Fibonacci strategy won't win every trade. The goal is consistent profitability over time, which requires disciplined risk management.
Once you've mastered the basic golden zone strategy, consider these advanced techniques:
Fibonacci Confluence:
Look for areas where multiple Fibonacci retracements overlap
Draw Fibonacci on different timeframes for added confirmation
Combine with horizontal support/resistance for powerful zones
Fibonacci Extensions:
Use extensions to project profit targets beyond the previous high
Common extension levels: 1.272, 1.618, 2.618
Particularly useful in strong trending markets
Fibonacci Time Zones:
Less common but can identify potential reversal dates
Works well with cyclical markets
Combine with price-based Fibonacci for comprehensive analysis
These advanced techniques can enhance your trading, but master the golden zone strategy first. Complexity doesn't always equal profitability.
The golden zone is the area between the 0.5 (50%) and 0.618 (61.8%) Fibonacci retracement levels. This zone has proven to be one of the most reliable areas for price to find support during pullbacks in uptrends or resistance during rallies in downtrends. It represents an optimal balance where the market has retraced enough to shake out weak positions while maintaining the overall trend structure.
Yes, Fibonacci retracement works on all timeframes, from 1-minute charts to monthly charts. The mathematical relationships remain consistent regardless of the timeframe. However, higher timeframes like 4-hour, daily, and weekly charts tend to produce more reliable levels due to increased participation and reduced noise. For day trading, combine multiple timeframe analysis for the best results.
Always use significant, clearly visible swing points on your chart. A valid swing low should have at least 2-3 candles on each side with higher lows, while a swing high should have lower highs on each side. The swings should be obvious without having to search for them. If you're questioning whether a point is significant enough, it probably isn't. Start with the most recent major move and work backwards.
Fibonacci levels are potential reversal zones, not guaranteed reversal points. Price action confirmation, such as bullish engulfing patterns, pin bars, or hammer candles, provides evidence that buyers or sellers are actually stepping in at these levels. This confirmation dramatically increases your win rate and helps avoid entering trades where price simply slices through the level without pausing.
Place your stop loss below the price action signal that confirmed your entry, not just below the Fibonacci level. For golden zone trades, this typically means placing the stop below the low of the reversal pattern (for long trades) or above the high (for short trades). If price breaks beyond the 0.786 level, it often signals the trend has changed, making this level a logical maximum stop area.
Fibonacci retracement is designed for trending markets and becomes less reliable in ranging or choppy conditions. In sideways markets, price may respect Fibonacci levels temporarily but lacks the directional momentum to create profitable follow-through. For best results, always ensure there's a clear trend before applying Fibonacci retracement. In ranging markets, consider using support/resistance levels or other range-trading strategies instead.
The Fibonacci trading strategy, when properly understood and applied, can transform your trading results. By focusing on the golden zone between 0.5 and 0.618, you're targeting the highest probability retracement area in trending markets. Combined with price action confirmation and proper risk management, this approach provides a complete trading system.
Remember, successful trading isn't about finding the perfect indicator – it's about understanding market dynamics and applying tools correctly. The Fibonacci retracement strategy works because it identifies where institutional traders often place orders, creating self-fulfilling prophecies at these mathematical levels.
Start by practicing this strategy on a demo account, focusing on perfecting your Fibonacci placement and waiting patiently for golden zone opportunities. With time and experience, you'll develop an intuitive feel for when these setups offer the best risk-reward potential.
The markets are constantly offering opportunities to those who know where to look. Now that you understand the power of the golden zone Fibonacci strategy, you're equipped to identify and capitalize on high-probability trading setups. Remember to always manage your risk, wait for confirmation, and let the probabilities work in your favor over time.
Disclaimer: This content is for educational purposes only and should not be considered financial advice. Trading involves substantial risk of loss. Always conduct your own research and consider your financial situation before making any investment decisions.
Perfect your Fibonacci drawing technique with this step-by-step visual guide for accurate level placement.
Dive deeper into advanced Fibonacci strategies including extensions, time zones, and multi-timeframe analysis.
Learn how Fibonacci levels create powerful support and resistance zones for precision entries and exits.
Identify the perfect swing highs and lows for anchoring your Fibonacci retracements with accuracy.
Trading & Investing Enthusiast
Teaching traders to understand market psychology, technical analysis, and investing through clear beginner-friendly insights.
Started investing at 16 and became fascinated by how market psychology influences price movements. Still learning something new every day.
Love sharing what I've learned along the way. There's nothing quite like helping someone understand a concept that once confused me too.
Proud to have built a community where traders actively share insights and grow together through daily market analysis and discussion.
Want to join our learning journey?
Find high-probability Fibonacci entries with advanced charting & execution