
Mastering Market Structure Trading: The Ultimate Guide 2025
Deep dive into market structure analysis including trends, ranges, and key level identification.
Prefer watching over reading? Perfect, in this YouTube video you will learn what price action trading is and how it differs from market structure—so you know exactly when to zoom out for the big picture and when to zoom in for your entry.
Market structure is the macro view — looking at the chart as a whole to identify ranges, breakouts, support, and resistance levels.
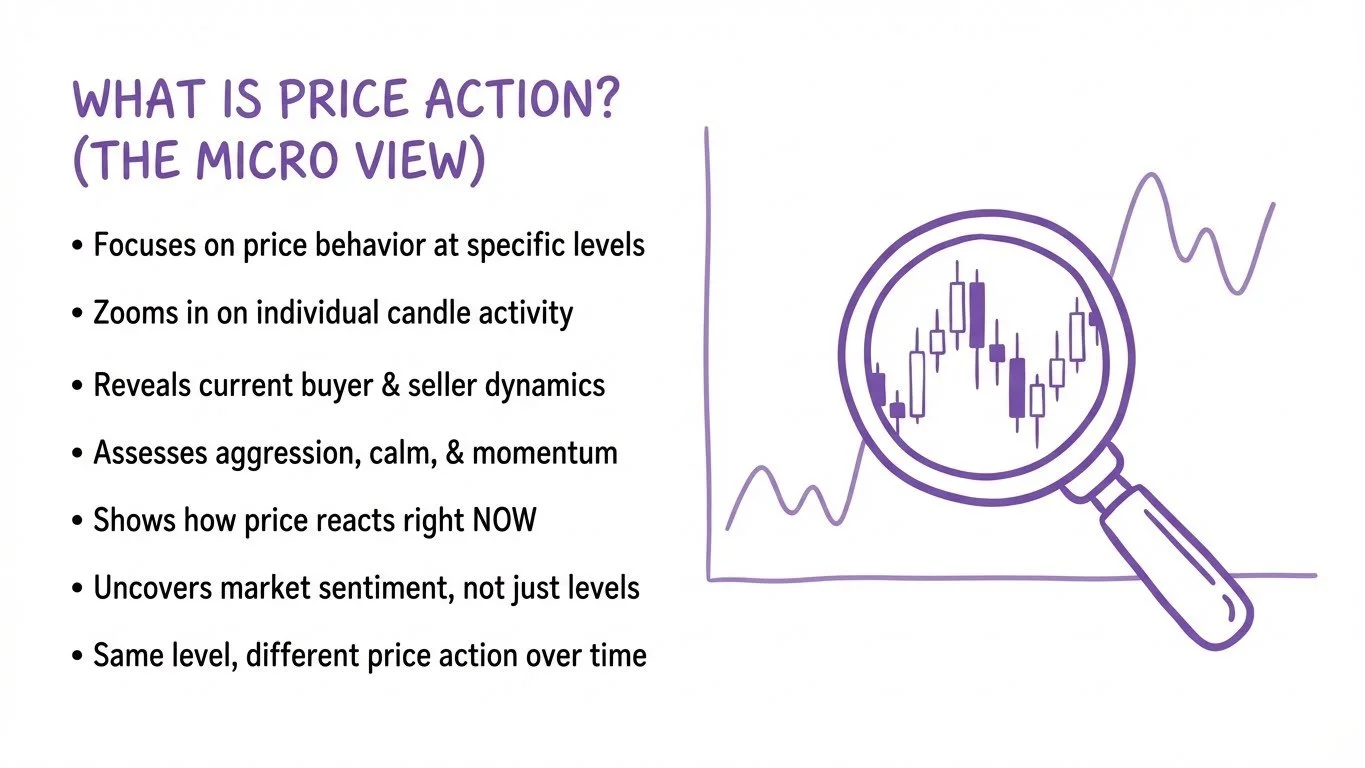
Price action is the micro view — zooming in on what price is doing when it reaches a specific level.
Same level, different behavior — the same support or resistance can produce completely different price action at different times.
Market structure tells you where — it identifies key levels where you should focus your attention.
Price action tells you when — it reveals the right moment to enter, exit, or stay out of a trade.
Most traders believe they understand price action, but here's the truth: they're actually looking at market structure. This fundamental confusion can lead to misinterpreted signals, poorly timed entries, and frustrating losses. Understanding the difference between these two concepts can transform how you analyze charts and make trading decisions.
In this guide, you'll learn exactly what separates price action from market structure, how to identify each on your charts, and why mastering both is essential for becoming a more consistent trader.

What is Market Structure in Trading?
When you look at a price chart as a whole, you're actually analyzing market structure. Market structure refers to the overall framework and patterns that emerge from price movement over time—the big picture view of what's happening in the market.
Market structure includes elements like:
Trading ranges: Areas where price consolidates between defined boundaries
Breakouts: Strong moves that push price beyond established ranges
Support levels: Price zones where buying pressure historically prevents further decline
Resistance levels: Price zones where selling pressure historically prevents further advance
Trend direction: The overall upward, downward, or sideways bias of price movement
Think of market structure as the "macro" view of the market. You're zooming out to see the forest rather than individual trees. This perspective helps you identify where significant price levels exist and understand the broader context of market movement.
For example, when examining a chart, you might observe a clear trading range forming over several days or weeks, followed by a strong breakout. You can identify where resistance has repeatedly rejected price advances and where support has consistently attracted buyers. All of these observations fall under market structure analysis.
What is Price Action in Trading?
Price action is fundamentally different from market structure. While market structure shows you the overall framework, price action focuses on what price is doing—or was doing—when it reaches a specific level. It's the "micro" view that zooms in on individual candle behavior and short-term price dynamics.
Price action analysis asks questions like:
How is price reacting to this resistance level right now?
What are the candles telling us about buyer and seller activity?
Is the movement aggressive or calm?
What momentum characteristics are present?
The key insight is that the same support or resistance level can produce completely different price action at different times. This is what makes price action analysis so valuable—it reveals the current market sentiment and participant behavior, not just where important levels exist.
Zoom Out — See the Big Picture
Zoom In — Read the Moment
TradingView's split-screen charts let you view macro structure and micro price action simultaneously—essential for applying this framework.
One helpful way to understand the relationship between these concepts is through the micro versus macro framework:
Market Structure = Macro View
When you zoom out and look at the bigger picture, you're analyzing market structure. You're identifying patterns, ranges, trends, and key levels that have developed over time. This gives you context and helps you understand where you are in the market's overall journey.
Price Action = Micro View
When you zoom in and examine specific moments in time, you're analyzing price action. You're looking at individual candles, short-term patterns, and immediate price behavior to understand what's happening right now at a particular level.
Both perspectives are essential. Market structure tells you where to focus your attention—the key levels and zones that matter. Price action tells you what to do when price arrives at those levels.
Let me illustrate this concept with a practical example. Imagine a chart showing a clear resistance level that price has tested multiple times.
First Test of Resistance: When price initially reached the resistance level, the price action was calm and non-aggressive. The candles moved sideways, showing little volatility or urgency. The market appeared to be pausing rather than reversing with conviction. This type of price action often suggests indecision—neither buyers nor sellers are dominating.
Second Test of Resistance: When price returned to that same resistance level later, the price action was completely different. This time, there was strong momentum, aggressive selling pressure, and clear rejection. The candles showed conviction from sellers who were defending that level.
Here's the critical insight: the market structure remained the same—resistance was still resistance. But the price action told two entirely different stories about market participant behavior and the probability of what might happen next.
Identify resistance with structure → Confirm entry with candle behavior
Price action helps you gauge position strength in real-time
Apply this framework on live markets with Bybit's advanced charting tools. Start with small positions to test your ability to read both structure and price action before scaling up.
Understanding the difference between price action and market structure can improve your trading in several important ways:
Better Entry Timing
Market structure tells you where to look for trades. Price action tells you when to take them. A resistance level might be identified through market structure analysis, but your actual entry decision should be based on the price action you observe when price reaches that level.
Improved Trade Management
Price action helps you gauge the strength of your position. If you're in a long trade approaching resistance and you see calm, sideways price action, the implications are different than if you see aggressive selling momentum. This information can guide decisions about taking profits, adjusting stops, or adding to positions.
Context for Every Decision
Combining both perspectives gives you a complete picture. You understand the significant levels from market structure and the current sentiment from price action. This combination helps you avoid common mistakes like entering at random levels or ignoring what the candles are telling you.
Many traders run into problems because they confuse these two concepts or focus on one while ignoring the other:
Mistake 1: Trading Market Structure Without Reading Price Action
Some traders identify a support level and immediately buy when price reaches it, without examining how price is behaving at that level. They assume the level will hold simply because it held before, ignoring signs that this time might be different.
Mistake 2: Reading Price Action Without Market Structure Context
Other traders become so focused on individual candles that they lose sight of where they are in the bigger picture. A bullish candle pattern means something different when it forms at major support versus when it forms in the middle of nowhere.
Mistake 3: Using the Terms Interchangeably
When traders don't distinguish between these concepts, their analysis becomes imprecise. Clear thinking requires clear language. Understanding exactly what you're analyzing—market structure or price action—helps you make more deliberate decisions.
Zoom out on your charts and establish your framework:
Identify and annotate the levels where you expect price to react:
When price approaches your marked levels, examine candle behavior:
Use price action to inform your actual trading decision:
The best way to internalize this process is through repetition. Use Bybit's charting tools to mark your structure levels, then practice reading price action as it approaches each zone. Start with demo trading or small positions until the 4-step process becomes second nature.
Here's a practical approach to incorporating both perspectives into your analysis:
Step 1: Start with Market Structure (Macro)
Begin by zooming out on your charts. Identify the overall trend, key support and resistance levels, trading ranges, and any significant chart patterns. This establishes your framework and highlights where important action is likely to occur.
Step 2: Mark Your Key Levels
Note the levels where you expect price to react. These become your areas of interest—the zones where you'll shift your attention to price action analysis.
Step 3: Zoom In for Price Action (Micro)
When price approaches your marked levels, switch to a closer examination. Watch how individual candles behave. Is the price action aggressive or calm? Are buyers or sellers showing strength? Is there momentum or hesitation?
Step 4: Make Your Decision
Use price action to inform your actual trading decision. The market structure got you interested in the level; the price action tells you whether to act.
When analyzing any chart, consider asking yourself these questions:
For Market Structure:
What is the overall trend direction?
Where are the significant support and resistance levels?
Is price in a range or trending?
What patterns or formations are visible?
For Price Action:
How is price reacting to this specific level right now?
Are the candles showing strength or weakness?
Is the movement calm or aggressive?
What does the current behavior suggest about participant sentiment?
By regularly asking both sets of questions, you can develop a more complete understanding of what the market is telling you.
Market structure is the macro (big picture) view of the chart—identifying overall trends, ranges, support and resistance levels, and breakouts. Price action is the micro view—focusing on how price behaves when it reaches specific levels, examining individual candle behavior, momentum, and participant sentiment.
Yes, this is one of the most important concepts to understand. The same level can produce completely different price action at different times. For example, price might approach resistance with calm, sideways movement one time, but approach the same resistance with aggressive momentum another time. The level (market structure) stays the same, but the behavior (price action) varies.
You need both. Market structure tells you where to focus your attention by identifying key levels and the overall trend. Price action tells you what to do when price reaches those levels by revealing current market sentiment. Using only one while ignoring the other can lead to poorly timed entries or trading in areas without proper context.
Key price action questions include: How is price reacting to this level right now? Are the candles showing strength or weakness? Is the movement calm or aggressive? Are buyers or sellers showing dominance? What does the current behavior suggest about what might happen next?
Calm price action typically shows sideways candle movement, small candle bodies, overlapping wicks, and little directional conviction. Aggressive price action shows strong momentum, larger candle bodies, minimal overlap, and clear directional movement. Recognizing these characteristics helps you gauge market sentiment at key levels.
Yes, price action concepts apply across all timeframes—from minute charts to weekly charts. The same principles of observing how price behaves at key levels work regardless of whether you're day trading or swing trading. Many traders use higher timeframes for market structure context and lower timeframes for price action entries.
The difference between price action and market structure is one of the most important distinctions a trader can understand. Market structure provides the macro framework—showing you trends, ranges, and key levels. Price action provides the micro details—revealing how price behaves when it reaches those levels.
Both perspectives are essential, and neither works as well in isolation. Market structure without price action lacks timing precision. Price action without market structure lacks context.
By learning to identify and analyze both, you can make more informed trading decisions, improve your entry and exit timing, and develop a deeper understanding of what the charts are really telling you.
Disclaimer: This content is for educational purposes only and should not be considered financial advice. Trading involves substantial risk of loss. Always conduct your own research and consider your financial situation before making any investment decisions.
Deep dive into market structure analysis including trends, ranges, and key level identification.
Master the core concepts of BoS and CHoCH to identify key turning points in the market.
Learn how to classify price levels to find the highest probability trading opportunities.
Discover how institutional traders hunt for liquidity and how you can profit from these movements.
Trading & Investing Enthusiast
Teaching traders to understand market psychology, technical analysis, and investing through clear beginner-friendly insights.
Started investing at 16 and became fascinated by how market psychology influences price movements. Still learning something new every day.
Love sharing what I've learned along the way. There's nothing quite like helping someone understand a concept that once confused me too.
Proud to have built a community where traders actively share insights and grow together through daily market analysis and discussion.
Want to join our learning journey?
The tools I use to read macro levels and micro candle behavior