
Break of Structure (BoS) and Change of Character (CHoCH) Trading Strategy
Learn to identify trend continuation vs reversal signals using these essential market structure concepts.
Prefer video? No worries, in this YouTube video, you'll learn everything you need to know about the bull flag pattern, from identifying the flagpole and consolidation phase, to the 3 confirmations that must align before entering a trade. You'll also see how to draw the pattern on TradingView, use volume to validate breakouts, and place your entry and stop loss with a real chart example.
The bull flag is one of the best day trading strategies for beginners, but most people trade it wrong. The pattern itself is simple to identify, yet traders consistently fail because they miss the three critical confirmations that need to line up before entering a trade.
In this comprehensive guide, you'll learn exactly how to identify bull flag patterns, understand why they work, and discover the specific criteria that can help separate high-probability setups from trades that are likely to fail. Whether you're day trading stocks, crypto, forex, or commodities like silver and gold, this pattern works across all markets and timeframes.
Bull Flag Pattern Examples
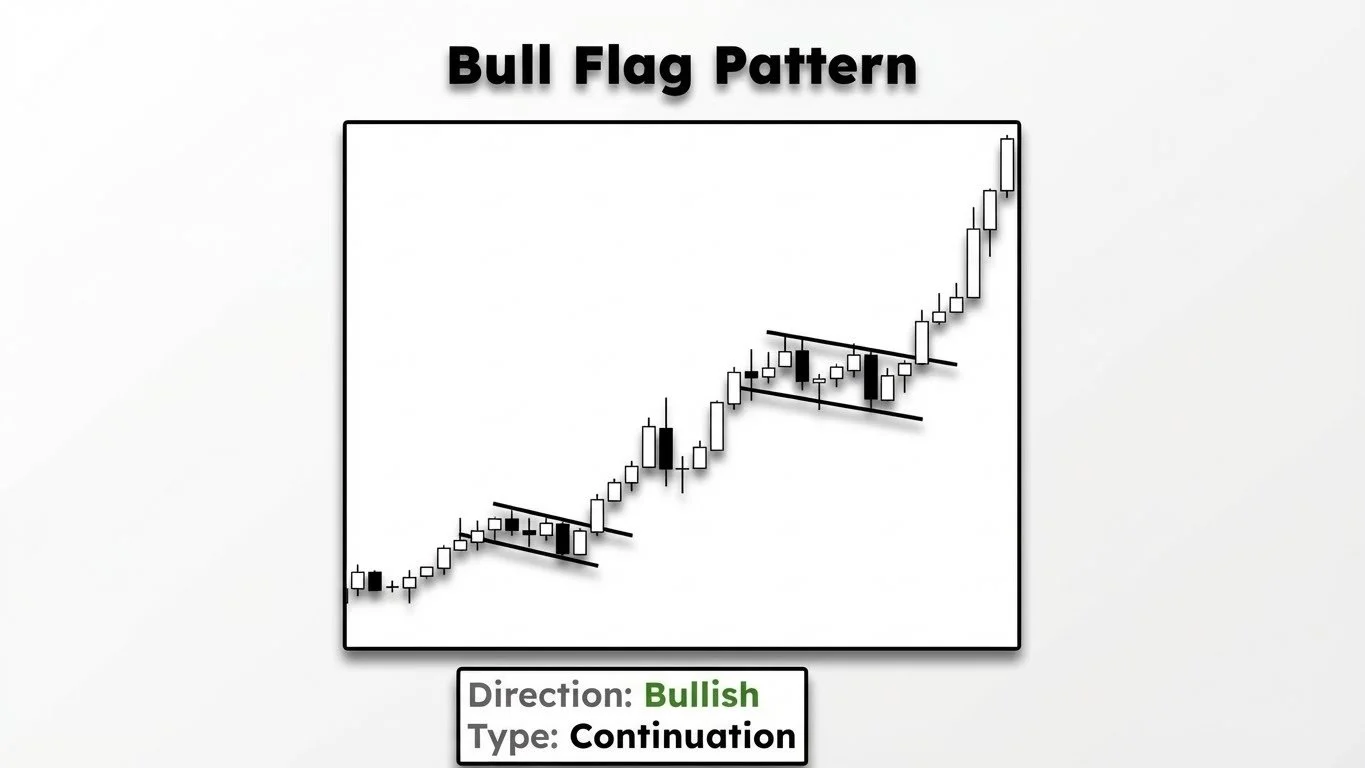
A bull flag is a bullish continuation pattern that appears during an uptrend. The name comes from its visual appearance on a chart—it literally looks like a flag on a pole.
The pattern consists of two main components. First, you have a strong move toward the upside, which forms what traders call the "flagpole." After this upward momentum, the price then consolidates and creates a small downtrend or sideways movement. This consolidation phase forms the actual "flag" portion of the pattern.
What makes the bull flag powerful is its underlying psychology. The initial upward move represents strong buying pressure and momentum. The consolidation that follows isn't a reversal—it's simply the market taking a breath. Traders who bought during the initial move are taking some profits, while new buyers are waiting for a better entry point.
The goal of this pattern is to continue the price toward the upside. When the consolidation ends and price breaks out of the flag, you often see a continuation of the original bullish momentum.
How to Identify Bull Flag Patterns
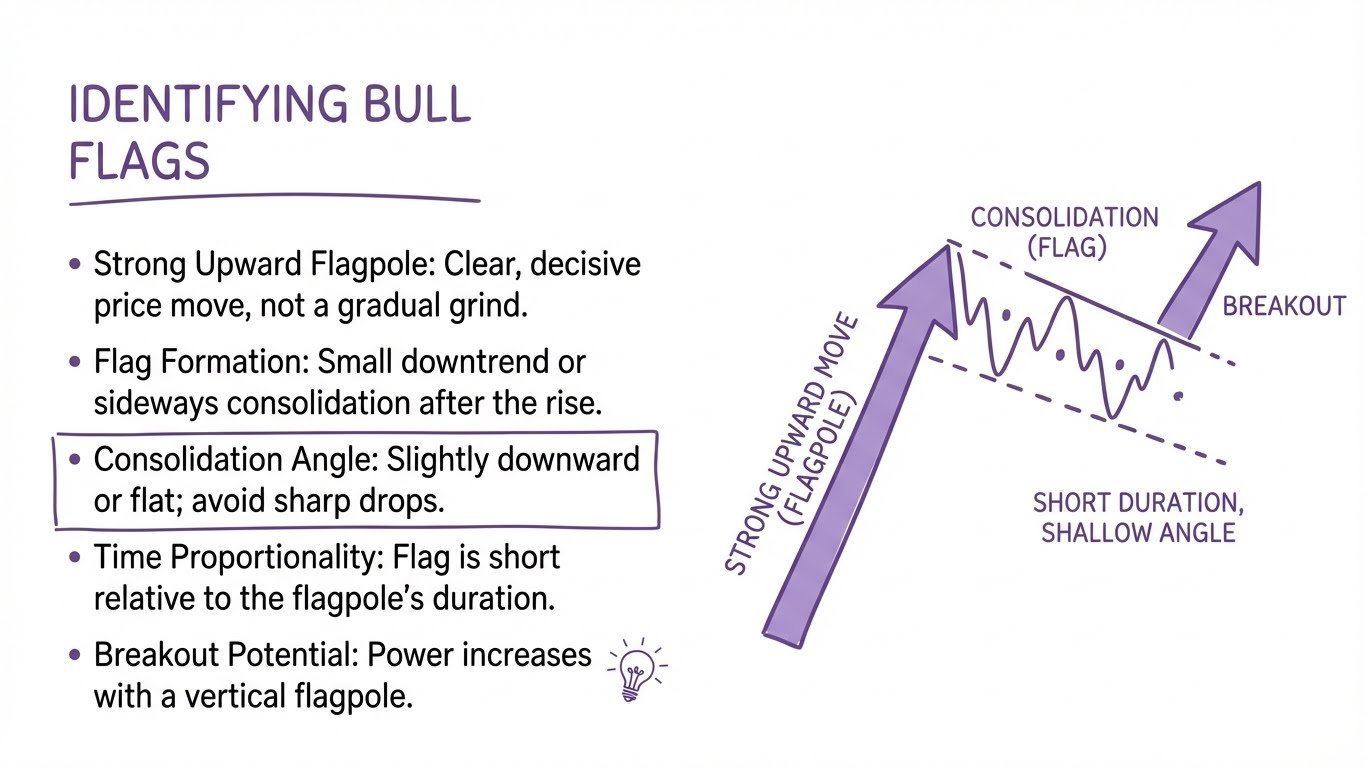
Identifying bull flags in real markets can be challenging at first because charts rarely look as clean as textbook examples. Here's what to look for:
The Flagpole: Before any bull flag can form, you need to see a strong move toward the upside. This should be a clear, decisive move—not a gradual grind higher. The stronger and more vertical this move, the more powerful the potential breakout.
The Flag Formation: After the upward move, watch for the price to consolidate. During this phase, the price creates a small downtrend, trading slightly downward or sideways. You can draw a resistance level at the top of this consolidation and a support level at the bottom.
The Angle: A proper bull flag should angle slightly downward or move sideways. If the consolidation moves sharply downward, it's no longer a bull flag—it could be a reversal forming instead.
Time Proportionality: The flag portion should be relatively short compared to the flagpole. A flag that takes too long to develop may indicate that the momentum has died and the pattern is invalid.
When looking at a silver chart on the daily timeframe, for example, you might spot a move toward the upside followed by a consolidation where the price cools down for a while and trades slightly downward. This is exactly what you're looking for.
Check each confirmation before entering your trade. All three must align for a high-probability setup.
This is where most traders go wrong. They see something that looks like a bull flag and immediately enter a trade without waiting for proper confirmation. Here are the three bullish factors that need to align:
1. The Pattern Itself (Bullish Structure)
The first confirmation is simply having a valid bull flag pattern. You need to see the uptrend, followed by the consolidation phase forming the flag. Without a proper pattern, there's nothing to trade.
2. Strong Breakout Candle (Bullish Price Action)
Price action is king. When the price bounces at the support of the flag and then breaks through the resistance, you need to see a strong bullish candle. This breakout candle should be convincing—a large green candle that closes decisively above the flag's resistance level.
A weak breakout with small candles or lots of wicks suggests uncertainty and reduces the probability of success. Always prioritize strong price action on the breakout.
3. High Volume on the Breakout
Volume confirms conviction. When you see a strong breakout candle accompanied by high volume, it tells you that significant buying pressure is behind the move. This makes the pattern more likely to succeed.
If the breakout happens on low volume, it could be a false breakout. The move lacks the conviction needed to sustain the continuation, and price may fall back into the flag or reverse entirely.
When you have all three of these factors—a valid pattern, strong price action, and high volume—you have a high-probability setup that can improve your chances of success.
TradingView makes it easy to identify and draw bull flag patterns. Here's the step-by-step process:
Click on the drawing tools panel on the left side of your chart
Select "Trend Line" from the menu
Draw a trend line along the resistance level of the flag (connecting the highs of the consolidation)
To quickly duplicate the line, press Ctrl+C then Ctrl+V
Drag the duplicated line to the support level of the flag (connecting the lows)
Now you have both boundaries of your flag clearly marked, making it easy to identify when a breakout occurs.
If you're serious about technical analysis and chart pattern trading, having a proper charting platform is essential. TradingView offers professional-grade tools that can help you spot these patterns more easily.
Adding volume analysis to your bull flag strategy can significantly improve your results. Here's how to use it effectively:
Adding the Volume Indicator:
Go to the Indicators tab at the top of TradingView
Search for "Volume"
You'll see numerous volume indicators—both built-in and community-created
Select the standard "Volume" indicator for simplicity
Reading Volume Bars: The height of each volume bar represents how much trading activity occurred during that candle. Taller bars mean more volume, shorter bars mean less activity.
To see exact volume numbers, hover over any bar and the precise volume will appear in the corner of your chart.
Volume on the Breakout: When analyzing your breakout candle, compare its volume to recent candles. You want to see volume that's notably higher than the average—this confirms that traders are actively participating in the breakout.
A note on commodities: Volume data for assets like silver and gold may not be as precise as volume data for stocks and cryptocurrencies. This is because commodities trade across multiple exchanges and markets. However, the volume indicator still provides useful relative information.
Once you've confirmed all three bullish factors, here's how to structure your trade:
Entry Point: Enter the trade at the candle close after the breakout. Don't jump in mid-candle—wait for it to close to confirm the breakout is valid.
Stop Loss Placement: There are two common approaches:
Below the pattern low: Set your stop loss below the lowest point of the entire bull flag pattern. This gives the trade room to breathe but requires a wider stop.
Below a recent swing low: If you can identify a swing low within the flag formation just before the breakout, you can place your stop below that level for a tighter stop loss.
The approach you choose depends on your risk tolerance and the specific chart structure.
Take Profit (Risk-to-Reward): A common approach is to use a risk-to-reward ratio of at least 1.5:1. This means if you're risking 100 pips (or dollars, or points), your target should be at least 150 pips.
Some traders use the measured move technique: measure the height of the flagpole, then project that distance from the breakout point. This gives you a technical target based on the pattern's structure.
Plan your trade before you enter. Input your levels to automatically calculate risk-to-reward ratio.
Let me walk you through a real example that demonstrates all these concepts.
Looking at a silver chart on the daily timeframe, you can identify a bull flag formation. Before the flag appeared, there was a clear move toward the upside. Then the price consolidated, creating a flag pattern where the price cooled down and traded slightly downward.
After this consolidation, a strong green candle appeared—exactly what we look for in terms of price action. Following this breakout candle, the price continued with a nice move toward the upside.
Checking the volume indicator on that breakout candle revealed high volume compared to the preceding candles. This confirmed conviction behind the move.
In this case, with the stop loss set below the low of the pattern and using a 1.5 risk-to-reward ratio, the trade would have been successful.
This example shows how technical analysis can be applied across different markets. Whether you're trading crypto, forex, stocks, or commodities like silver and gold, the same principles apply.
Jumping into a trade just because something "looks like" a bull flag without verifying pattern, price action, and volume.
Confirm valid pattern structure + strong breakout candle + high volume before entering. Skip setups missing any element.
Taking bull flag setups on lower timeframes while the daily or weekly chart is in a clear downtrend.
Check higher timeframes first. Trade bull flags that align with the overall trend direction for higher probability.
Entering on weak, small-bodied candles with long wicks that show hesitation rather than conviction.
Only enter when the breakout candle is large, bullish, and closes decisively above resistance. No conviction = no trade.
Placing stops just a few ticks below the breakout level, getting stopped out by normal price fluctuations.
Place stops below the pattern low or a clear swing low. Give the trade room to breathe while protecting capital.
Entering late after the price has already moved significantly, resulting in poor risk-to-reward and emotional trading.
If you miss the initial breakout, wait for a potential retest of the breakout level—or simply find the next setup.
Entering Without All Three Confirmations: The most common mistake is entering a trade just because something looks like a bull flag. Always wait for the pattern, strong price action, and volume to align.
Trading Against the Higher Timeframe Trend: Bull flags work best when they align with the broader market direction. A bull flag on a 5-minute chart means little if the daily chart is in a strong downtrend.
Ignoring the Breakout Candle Quality: A weak, indecisive breakout candle often leads to failed patterns. If the breakout doesn't look convincing, it's better to skip the trade.
Setting Stop Losses Too Tight: While tight stops seem safer, they often get hit by normal price fluctuations. Give your trade room to work by placing stops at logical levels.
Chasing After the Breakout: If you miss the initial breakout, don't chase the trade. Wait for a potential retest of the breakout level or move on to the next opportunity.
A bull flag forms during an uptrend and signals potential continuation to the upside. The flag portion slopes downward or sideways. A bear flag is the opposite—it forms during a downtrend with the flag portion sloping upward, signaling potential continuation to the downside. Both patterns share the same structure (pole + flag), just in opposite directions.
The flag portion should be relatively short compared to the flagpole. Typically, if the flagpole took a few candles to form, the flag consolidation shouldn't take significantly longer. A flag that drags on too long may indicate that momentum has died and the pattern is becoming invalid. The exact timeframe depends on your trading timeframe—a daily chart flag might take several days, while a 15-minute chart flag might form over a few hours.
Yes, bull flags can be traded on any timeframe from 1-minute charts up to weekly charts. However, patterns on higher timeframes tend to be more reliable because they filter out market noise. Many traders use multi-timeframe analysis—identifying patterns on higher timeframes while using lower timeframes for precise entry timing.
A breakout on low volume is a warning sign. Without strong volume confirming the move, there may not be enough buying pressure to sustain the continuation. In this case, you might choose to skip the trade entirely, wait for volume to increase, or take a smaller position size. Low volume breakouts have a higher probability of failing or turning into false breakouts.
The most common stop loss placement is below the lowest point of the entire flag pattern. This gives your trade room to breathe while still invalidating your thesis if the pattern fails. Alternatively, if you can identify a clear swing low just before the breakout within the flag, you can place your stop below that level for a tighter stop. The key is placing it at a level where, if hit, the pattern would clearly be invalid.
Bull flags work across all markets where technical analysis can be applied—stocks, cryptocurrencies, forex, and commodities like silver and gold. The pattern reflects universal market psychology: momentum followed by consolidation followed by continuation. The specific market matters less than finding liquid instruments with clear price action and reliable volume data.
The bull flag pattern is a powerful tool for day traders when used correctly. The key is patience—waiting for all three confirmations before entering: a valid pattern structure, strong breakout price action, and high volume confirmation.
Remember that chart patterns are just one piece of the trading puzzle. They work best when combined with proper risk management and an understanding of overall market structure. No pattern works every time, but by focusing on high-probability setups where multiple factors align, you can improve your trading results over time.
If you want to deepen your understanding of chart patterns and technical analysis, consider exploring more advanced concepts like market structure, support and resistance levels, and candlestick patterns. These all work together to give you a complete picture of what's happening in the market.
Disclaimer: This content is for educational purposes only and should not be considered financial advice. Trading involves substantial risk of loss. Always conduct your own research and consider your financial situation before making any investment decisions. Past performance does not guarantee future results.
Learn to identify trend continuation vs reversal signals using these essential market structure concepts.
Understand how to read market structure to identify trend direction and optimal pattern entries.
Master the art of trading breakouts with proven strategies for entries, exits, and risk management.
Learn to draw and trade key support and resistance levels—essential for flag pattern trading.
Trading & Investing Enthusiast
Teaching traders to understand market psychology, technical analysis, and investing through clear beginner-friendly insights.
Started investing at 16 and became fascinated by how market psychology influences price movements. Still learning something new every day.
Love sharing what I've learned along the way. There's nothing quite like helping someone understand a concept that once confused me too.
Proud to have built a community where traders actively share insights and grow together through daily market analysis and discussion.
Want to join our learning journey?
The tools I use to draw flags, confirm volume & execute breakouts