
Mastering Market Structure Trading: The Ultimate Guide 2025
Learn how market structure provides the macro context that makes price action signals more reliable.
Last Updated: December 9, 2025
Prefer watching over reading? Perfect, in this YouTube video you will learn what price action trading is, how to read candlestick patterns like hammers and engulfing candles, and how to combine them with support and resistance for higher probability setups.
Price action is what price is doing NOW while market structure is what price has done in the past—you need both for complete analysis.
Momentum candles (bodies at least 2x larger than previous candles) often signal the start of significant moves and breakouts.
Context matters more than patterns—candlestick patterns are most reliable when they form at key support and resistance zones.
Volume confirms price action—high volume validates patterns and breakouts; low volume is a warning sign to be skeptical.
These principles work across all markets (stocks, crypto, forex) and all timeframes (daily, hourly, 5-minute charts).
Price action is arguably the most important concept in trading. Whether you trade stocks, crypto, forex, or any other market, understanding how to read price movements can dramatically improve your trading decisions.
The beauty of price action trading lies in its universality. It doesn't matter if you prefer using indicators, trading chart patterns, or whether you're a day trader or swing trader—you can always benefit from improving your price action skills.
But here's the challenge: price action is one of the most misunderstood concepts in the trading community. Many traders confuse it with market structure, leading to incomplete analysis and missed opportunities.
In this comprehensive guide, you'll learn everything from the fundamentals of candlestick reading to advanced breakout strategies. By the end, you'll understand how to read the market's behavior in real-time and apply these insights to potentially generate more consistent results.
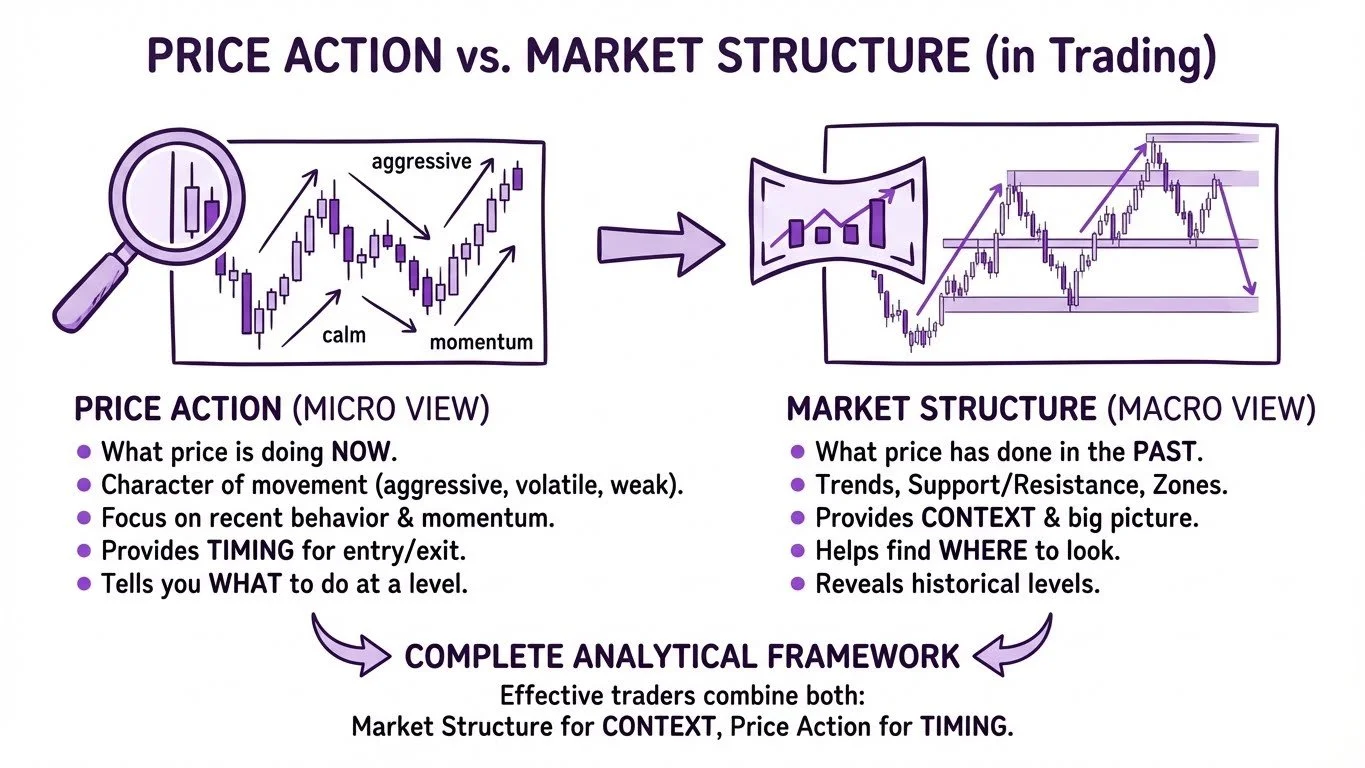
Price Action vs. Market Structure (in Trading)
Before diving into strategies, we need to establish a clear definition because this is where many traders get confused.
Price action is about what the price is doing right now. It focuses on the character of price movement—how the price is behaving, whether it's aggressive or weak, volatile or calm.
Market structure, on the other hand, is what the price has done in the past. When you look at a candlestick chart and see trends, zones, support and resistance levels, and supply and demand areas, you're actually looking at market structure.
Think of it this way: price action is the micro view (zooming in), while market structure is the macro view (zooming out).
When you look at a chart as a whole, you're examining market structure. But when you zoom in on how price reacted to a specific level—the character of those candles, the momentum, the hesitation—that's price action.
Here's why this distinction matters for your trading:
Market structure helps you find WHERE to look. For example, you might identify an important support level that you should watch in the future.
Price action tells you WHAT to do when you get there. It reveals when to enter, when to exit, and whether the level is likely to hold or break.
The most effective traders combine both. Market structure provides context, while price action provides timing. Together, they create a complete analytical framework.
To master price action, you first need to master reading candlesticks. Each candle on your chart tells a story about the battle between buyers and sellers.
Every candlestick consists of four key data points, often abbreviated as OHLC:
Open: Where the price started when the candle began
High: The highest price reached during the candle
Low: The lowest price reached during the candle
Close: Where the price ended when the candle finished
For a green (bullish) candle, the open is at the bottom of the body and the close is at the top. For a red (bearish) candle, it's reversed—the open is at the top and the close is at the bottom.
These principles apply regardless of your timeframe. A candle could represent one day, one hour, five minutes, or even one minute. The price action concepts you'll learn here work across all timeframes, making them valuable for day traders, swing traders, and position traders alike.
The Body: Who's in Control?
The wide part of the candle is called the body (or real body). The body tells you who won the battle during that period.
A large body indicates strong control. If you see a tall green body, buyers dominated that period. A tall red body means sellers were in charge.
A small body suggests hesitation—neither buyers nor sellers could establish clear dominance.
The Wicks: Where Did Price Get Rejected?
The lines extending above and below the body are called wicks (also known as shadows). Wicks reveal rejection and reaction.
A long lower wick on a green candle, for instance, shows that sellers pushed price down during the candle, but buyers ultimately rejected those lower prices and pushed back up before the close. This is valuable information about buying pressure at that level.
When you see a candle with a long upper wick near a resistance level, you're seeing evidence that buyers tried to push higher but got rejected by sellers. This is the kind of price action insight that can help you make better trading decisions.
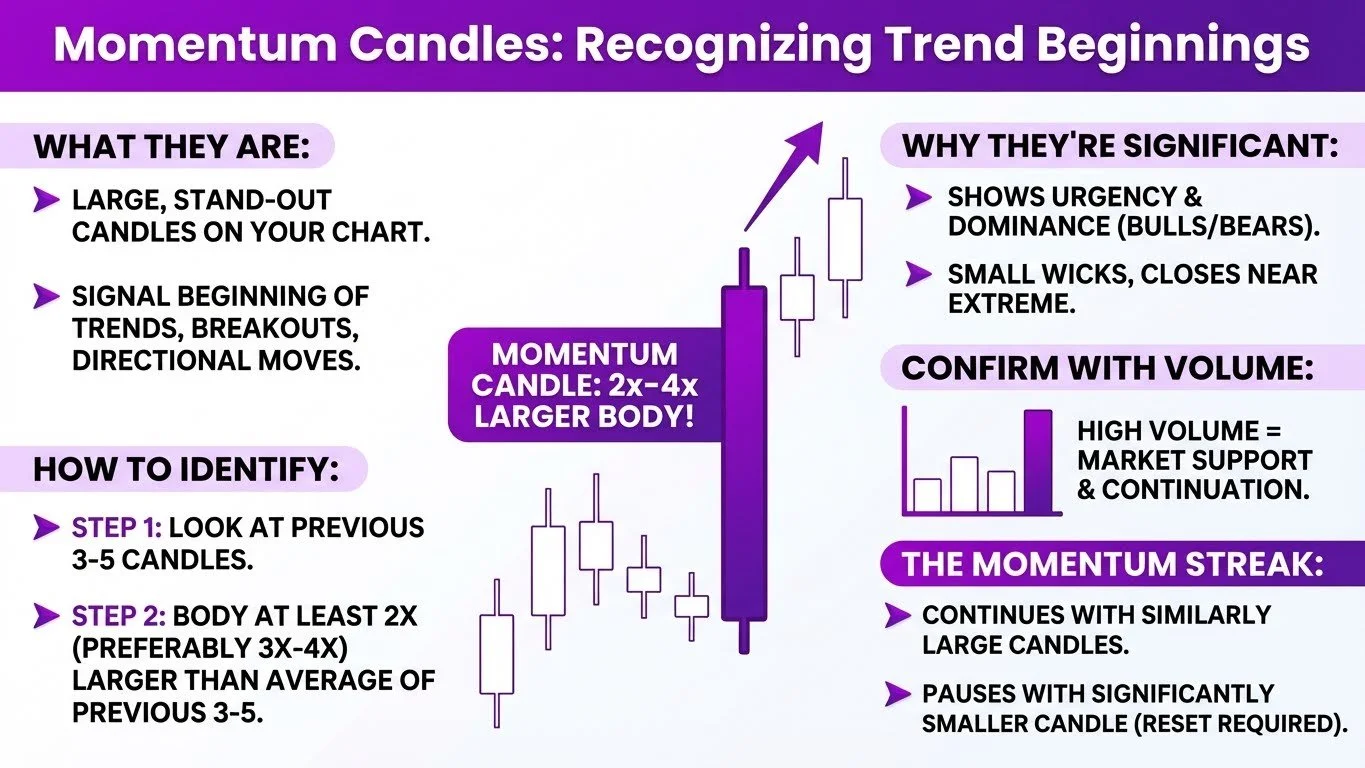
Momentum Candles in Trading
Momentum candles are one of the most important candlestick types you need to recognize. These are large candles that stand out on your chart—the ones that immediately catch your eye.
Why are momentum candles so valuable? They often signal the very beginning of trends, breakouts, and significant directional moves. If you can spot them early, you may be able to capture substantial price movements.
How to Identify Momentum Candles:
The key rule is that the body should be at least twice the size of the previous candle. Preferably, you want the body to be three or four times larger than the average of the previous three to five candles.
Here's the step-by-step approach:
Look at the previous three to five candles
Estimate their average body size
If the current candle's body is at least twice that average, you have a momentum candle
What Makes Momentum Candles Significant:
Momentum shows urgency. It demonstrates that one side—either bulls (buyers) or bears (sellers)—is clearly dominating. A strong momentum candle has a big body, small wicks, and closes near its extreme (near the high for bullish, near the low for bearish).
Volume Confirmation:
When you see real momentum, you ideally want to see it confirmed by high volume. This indicates that many market participants are supporting the move, making it more likely to continue.
The Momentum Streak:
Once you identify a momentum candle, the streak continues as long as subsequent candles are about the same size or larger. When you see a significantly smaller candle, the momentum has paused—you'll need to reset and look for a new momentum signal.
Candlestick patterns are formations of one or more candles that create recognizable shapes. These patterns reveal the psychology behind price movements—the ongoing battle between buyers and sellers.
Patterns fall into two main categories:
Reversal Patterns: Signal potential trend changes
Continuation Patterns: Indicate the current trend may continue
One critical principle: candlestick patterns are most reliable when they form at key zones like support, resistance, or trend lines. The context (where the pattern appears) is often more important than the pattern itself.
The hammer is one of the most common and effective reversal patterns. It's a single-candle bullish pattern that signals potential reversals from downtrends.
Identification Rules:
Must appear after a move to the downside
Small body (either green or red)
Long lower wick (at least twice the body length)
Little or no upper wick
The hammer tells a story: during the candle, sellers pushed price down significantly, but buyers stepped in with enough force to push price back up near the opening level. This rejection of lower prices suggests potential buying interest.
How to Trade the Hammer:
Entry: At the candle close of the hammer pattern
Stop-loss: Below the low of the hammer's wick
Target: Use a fixed risk-to-reward ratio (2:1 is common)
The hammer becomes more significant when it forms at a known support level or after an extended downtrend.
The shooting star is the bearish mirror of the hammer—a single-candle pattern that signals potential reversals from uptrends.
Identification Rules:
Must appear after a move to the upside
Small body (either green or red)
Long upper wick (at least twice the body length)
Little or no lower wick
This pattern shows that buyers tried to push higher during the candle but were overwhelmed by sellers who pushed price back down. The long upper wick represents rejection of higher prices.
How to Trade the Shooting Star:
Entry: At the candle close
Stop-loss: Above the high of the upper wick
Target: Use a 2:1 or 3:1 risk-to-reward ratio
Like all patterns, the shooting star gains significance when it appears at a resistance level.
Engulfing patterns are two-candle formations that are both common and powerful. They appear frequently and offer clear trading signals.
Bullish Engulfing Identification:
Appears after a downtrend
First candle is red (preferably small body)
Second candle is green
The green candle opens below the red candle's body and closes above it
The green candle "engulfs" the red candle
Note: In crypto markets (which trade 24/7 without gaps), it's acceptable if the green candle opens at the same level as the red candle's close, as long as it closes well above the red candle's open.
Bearish Engulfing Identification:
Appears after an uptrend
First candle is green (preferably small body)
Second candle is red
The red candle opens above the green candle's body and closes below it
Trading Engulfing Patterns:
Entry: At the close of the engulfing candle
Stop-loss: Beyond the pattern's extreme (below the low for bullish, above the high for bearish)
Target: Use fixed risk-to-reward ratios
When an engulfing pattern forms at a key support or resistance level, you have two confirming signals, which can increase the probability of success.
A doji is a candle where the open and close are at essentially the same level, creating little or no body. Dojis represent market indecision—neither buyers nor sellers could establish control.
Types of Doji:
Classic Doji: Upper and lower wicks are roughly equal length. Signals neutral indecision.
Long-Legged Doji: Similar to classic but with longer wicks, showing more volatile indecision. The position of the tiny body matters—closer to the top is slightly more bullish, closer to the bottom is slightly more bearish.
Dragonfly Doji: Open and close are near the high of the candle with a long lower wick. This is bullish—it shows sellers pushed price down but buyers completely recovered. Very similar to a hammer.
Gravestone Doji: Open and close are near the low of the candle with a long upper wick. This is bearish—buyers pushed up but sellers completely rejected the move.
Dojis become most significant when they appear at key support or resistance levels. A dragonfly doji at support or a gravestone doji at resistance can be powerful reversal signals.
Bookmark this table for quick pattern identification during live trading.
| Pattern | Type | Appears After | Key Features | Entry | Stop-Loss |
|---|---|---|---|---|---|
| Hammer | Bullish | Downtrend | Small body, long lower wick (2x+ body), little/no upper wick | Candle close | Below wick low |
| Shooting Star | Bearish | Uptrend | Small body, long upper wick (2x+ body), little/no lower wick | Candle close | Above wick high |
| Bullish Engulfing | Bullish | Downtrend | Green candle fully engulfs prior red candle's body | Candle close | Below pattern low |
| Bearish Engulfing | Bearish | Uptrend | Red candle fully engulfs prior green candle's body | Candle close | Above pattern high |
| Dragonfly Doji | Bullish | Downtrend / Support | Open/close at high, long lower wick, no upper wick | Next candle confirmation | Below wick low |
| Gravestone Doji | Bearish | Uptrend / Resistance | Open/close at low, long upper wick, no lower wick | Next candle confirmation | Above wick high |
| Classic Doji | Neutral | Any trend | Open ≈ close, equal upper/lower wicks | Wait for confirmation | Beyond doji extreme |
| Momentum Candle | Continuation | Any (signals start) | Body 2x+ average of last 3-5 candles, small wicks | Candle close (with trend) | Beyond candle extreme |
💡 Pro Tip: Patterns are most reliable when they form at key support/resistance levels. Always check volume for confirmation.
Support and resistance are areas on the chart where price tends to react. Support is where price tends to bounce up; resistance is where price tends to reverse down.
Think of support and resistance as zones rather than perfect lines. In real markets, you'll rarely see price respect exact levels—it's more about areas where buying or selling pressure tends to emerge.
The Power of Combining Price Action with S/R:
When price reaches an important support or resistance level, that's when you should pay closest attention to price action. The behavior of candles at these levels tells you whether the level is likely to hold or break.
Signs of Strong Support/Resistance:
Sharp reactions with long wicks (showing rejection)
Reversal candlestick patterns (hammers at support, shooting stars at resistance)
Price moves away quickly with strong momentum candles
Quick reaction indicates strength; slow hovering indicates weakness
Signs That a Level May Break:
Lower highs pressing into support (or higher lows into resistance)
Small indecision candles clustering near the level
Rising volume during weak tests
Momentum candles breaking through with conviction
Historical Price Action Matters:
When analyzing a support or resistance level, consider how price behaved during previous touches. If past touches showed strong reactions with momentum candles and hammers, the level is more likely to produce strong reactions in the future.
If previous touches showed hesitation with dojis and small candles, the level may be weaker than it appears.
Breakouts occur when price moves beyond a key level—often the beginning of significant trends. They can create opportunities for quick profits, but they require careful analysis to avoid false signals.
Signs of a Valid Breakout:
Strong Momentum Candle: The breakout candle should be at least twice the size of recent candles. For breakouts, three times or more is even better.
Clear Close Beyond the Level: The candle should close well beyond the support or resistance, not just wick through it.
High Volume: Volume should spike during the breakout, confirming that many traders support the move.
Obvious Level: The more traders are watching a level, the more significant the breakout. Well-established support and resistance levels on higher timeframes tend to produce the most reliable breakouts.
Follow-Through Candles: After the breakout candle, watch for additional momentum candles in the same direction. This confirms the breakout is real.
Breakout Trading Strategies:
Immediate Entry: Enter at the close of the breakout candle with a stop-loss on the opposite side of the broken level.
Confirmation Entry: Wait for one more momentum candle after the breakout before entering.
Retest Entry: Wait for price to pull back and retest the broken level (resistance becomes support, support becomes resistance), then enter when you see bullish or bearish price action confirming the new level.
Not every breakout is real. False breakouts—also called fakeouts—occur when price briefly moves beyond a level but fails to continue in that direction.
Warning Signs of a False Breakout:
Weak Breakout Candle: Small body, doesn't look like a momentum candle
Wick Only: Price wicks above/below the level but doesn't close beyond it
No Volume Increase: Breakout occurs on low or average volume
Immediate Opposite Candles: Strong candles in the opposite direction form right after the breakout attempt
Why False Breakouts Are Opportunities:
False breakouts aren't just something to avoid—they can be excellent trading opportunities. When price tries to break a level and fails, it often reverses sharply in the opposite direction.
For example, if price wicks above resistance but then forms a bearish engulfing pattern, that's a high-probability short setup. The failed breakout confirms the resistance while the engulfing pattern signals the reversal.
Use this checklist before entering any breakout trade. Compare what you see against both columns.
Breakout candle is 2-3x size of recent candles with small wicks
Candle closes well beyond S/R, not just wicks through
Volume significantly higher than recent average
S/R visible on higher timeframes with multiple touches
Additional momentum candles continue in breakout direction
Small body, doesn't stand out from recent price action
Price wicks through level but closes back inside
No volume spike to confirm institutional participation
S/R only visible on lower timeframes or few touches
Strong opposite-direction candles form right after break
TradingView Premium includes Volume Profile, advanced alerts, and multi-chart layouts to validate breakouts faster.
Volume measures how many market participants are active during a move. It's the missing piece that helps confirm whether what you're seeing in the candles is significant.
Key Volume Principles:
High Volume = Confirmation: When a momentum candle or candlestick pattern appears with high volume, it means many traders participated in that move. The signal becomes more reliable.
Low Volume = Skepticism: When you see a big move on low volume, be skeptical. It might not represent genuine market conviction.
Volume Divergence: If price is rising but volume is falling, it may signal trend exhaustion. The move lacks the participation to sustain itself.
Volume Spikes at Highs/Lows: Unusually high volume at a high or low point often marks a significant turning point worth watching.
The Same Candle Can Mean Different Things:
Consider two identical-looking momentum candles. One has volume of 10, the other has volume of 10,000. The candle with 10 volume might have been created by a single trader. The candle with 10,000 volume required 1,000 times more participation. Which one is more significant? The high-volume candle represents genuine market consensus.
This is why volume should always be part of your price action analysis. The candles tell you what happened; volume tells you how many people agreed with it.
While price action trading focuses on reading raw charts, certain indicators can help you identify patterns and levels more efficiently. Here are the most useful tools for price action traders.
To access these, you'll need a charting platform. TradingView offers a robust free version, and if you want access to premium features, you can try TradingView Premium free for 30 days and get a $15 bonus.
Access professional charting tools, candlestick pattern detection, and volume indicators used by traders worldwide. All the indicators mentioned in this guide are available on TradingView.
All Candlestick Patterns Indicator:
Search for "All Candlestick Patterns" in TradingView's indicator library. This indicator automatically detects candlestick patterns and marks them on your chart.
Recommended settings:
Enable: Hammer, Shooting Star, Engulfing patterns
Detect trend based on: SMA 50 (this filters out patterns that don't appear after proper trends)
Pivot Points High Low Indicator:
Search for "Pivot Points High Low" to find this TradingView-built indicator. It automatically identifies significant swing highs and lows—the building blocks of support and resistance.
Recommended settings:
Pivot High: 20
Pivot Low: 20
These settings use 20 candles on each side to identify pivots, resulting in fewer but more significant levels.
When you find areas with multiple pivot points clustered together, those tend to be key support and resistance zones.
Volume Profile (Fixed Range):
The Volume Profile shows you where volume occurred at different price levels, not just per candle. This helps identify value areas where lots of trading occurred versus areas price moved through quickly.
Use the Fixed Range Volume Profile to analyze specific moves. Areas with high volume can act as support/resistance, while low-volume areas suggest price may move through them more easily.
Now that you understand the components, here's how to combine them into a practical trading approach:
Follow this 6-step workflow before every trade to combine market structure, price action, and risk management.
Zoom out. Where are the key support/resistance levels? What's the overall trend direction?
Don't trade in "no man's land." Wait for price to approach significant S/R, trendlines, or zones.
Zoom in. What are the candles telling you? Look for momentum, reversal patterns, rejection wicks.
Is volume supporting what you see? High volume confirms conviction. Low volume = be skeptical.
Define your plan BEFORE clicking buy/sell. Use the pattern to guide placement.
After each trade, analyze what happened. Did price action give expected signals? What could improve?
TradingView gives you multi-timeframe layouts, drawing tools, and volume indicators to run this framework efficiently.
Step 1: Identify Market Structure (Macro)
Look at the bigger picture. Where are the key support and resistance levels? What's the overall trend? This tells you WHERE to focus your attention.
Step 2: Wait for Price to Reach Key Levels
Don't trade in the middle of nowhere. Wait for price to approach significant support, resistance, or trend lines.
Step 3: Analyze Price Action at the Level (Micro)
When price reaches your level, zoom in. What are the candles telling you? Are you seeing strong reactions (long wicks, momentum candles, reversal patterns) or weak reactions (dojis, small bodies, hovering)?
Step 4: Confirm with Volume
Is volume supporting what you're seeing? High volume on reversal patterns or breakout candles adds confidence.
Step 5: Execute with Clear Risk Management
Define your entry, stop-loss, and target BEFORE entering. Use the patterns themselves to guide placement (stops beyond pattern extremes, targets at logical levels or fixed risk-to-reward ratios).
Step 6: Review and Learn
After each trade, analyze what happened. Did price action give you the signals you expected? What could you do differently? This continuous learning is what separates developing traders from struggling ones.
Trading Patterns in Isolation: A hammer in the middle of a range means little. Always consider where the pattern forms.
Ignoring Volume: Two identical candles with different volume tell different stories. Always check volume.
Confusing Market Structure with Price Action: Remember—market structure is the map, price action is the real-time GPS. You need both.
Over-Trading: Not every candle pattern is tradeable. Wait for high-probability setups at key levels.
Skipping the Learning Curve: Reading about price action is different from seeing it in real-time. Practice on historical charts and in demo accounts before risking real capital.
Price action is actually a subset of technical analysis. While technical analysis encompasses all chart-based methods including indicators, oscillators, and mathematical calculations, price action focuses specifically on reading raw price movements—candlesticks, wicks, bodies, and patterns—without relying on lagging indicators. Many traders consider price action the purest form of technical analysis because it deals directly with what price is doing rather than derivative calculations.
Yes, price action principles apply across stocks, forex, crypto, futures, commodities, and any other liquid market. The core concepts—candlestick reading, momentum identification, support/resistance interaction—are universal because they reflect the underlying psychology of buyers and sellers. The main adjustment is volume analysis: stocks and crypto have straightforward volume data, while forex typically uses tick volume as a proxy.
Price action works on all timeframes, but higher timeframes (daily, 4-hour, 1-hour) generally produce more reliable signals because more traders are watching those levels. Many successful traders use multi-timeframe analysis: identifying key levels and trends on higher timeframes, then using lower timeframes for precise entries. Beginners often find daily charts easier to read because they filter out intraday noise.
A pattern gains validity from three main factors: context (does it appear at a key support/resistance level or after a clear trend?), volume (is high volume confirming the signal?), and follow-through (do subsequent candles support the expected direction?). A hammer in the middle of a range is far less significant than a hammer at strong support with high volume followed by bullish candles.
While pure price action traders prefer clean charts, there's nothing wrong with using indicators as confirmation tools. Volume indicators are particularly valuable since they add context to what you're seeing in the candles. Moving averages can help identify trends and dynamic support/resistance. The key is not to rely on indicators for signals—use price action for decisions and indicators for confirmation.
Understanding the concepts may take a few weeks of focused study, but developing the skill to read price action in real-time typically requires months of practice. Like any skill, proficiency comes from repetition—analyzing historical charts, practicing pattern recognition, and reviewing your own trades. Most traders find they're comfortable with the basics after 3-6 months of consistent practice.
The engulfing pattern (both bullish and bearish) is often recommended for beginners because it's common, easy to identify, and provides clear entry/stop-loss parameters. Once you're comfortable with engulfing patterns, add hammer and shooting star patterns to your toolkit. These three patterns cover most reversal scenarios you'll encounter.
Price action trading is a skill that develops over time. The concepts you've learned here—candlestick anatomy, momentum candles, reversal patterns, support/resistance integration, breakout trading, and volume analysis—form the foundation of reading any market.
Remember these core principles:
Price action (what's happening now) + Market structure (what happened before) = Complete analysis
Context matters more than patterns
Volume confirms what candles suggest
The best setups combine multiple confirming factors
Risk management is non-negotiable
The key to improvement is practice. Apply these concepts to your charts today. Start with historical examples where you can see what happened next, then gradually transition to live markets.
If you want to dive even deeper, consider exploring order flow trading, which looks at what's happening inside the candles themselves. This advanced approach can take your price action skills to the next level.
Disclaimer: This content is for educational purposes only and should not be considered financial advice. Trading involves substantial risk of loss. Past performance of patterns and strategies does not guarantee future results. Always conduct your own research and consider your financial situation before making any investment decisions.
Learn how market structure provides the macro context that makes price action signals more reliable.
Deep dive into identifying key levels where price action signals become most powerful.
Expand your pattern recognition with additional reversal and continuation candlestick formations.
Advanced breakout techniques using price action and volume confirmation for higher probability trades.
Trading & Investing Enthusiast
Teaching traders to understand market psychology, technical analysis, and investing through clear beginner-friendly insights.
Started investing at 16 and became fascinated by how market psychology influences price movements. Still learning something new every day.
Love sharing what I've learned along the way. There's nothing quite like helping someone understand a concept that once confused me too.
Proud to have built a community where traders actively share insights and grow together through daily market analysis and discussion.
Want to join our learning journey?
The tools I use to apply these strategies across all markets