
Mastering Market Structure Trading: The Ultimate Guide
Learn to identify trends, ranges, and key turning points that determine RSI context.
The RSI (Relative Strength Index) is a momentum indicator that measures price movement speed and direction on a 0-100 scale. RSI above 70 signals strong bullish momentum (overbought), while below 30 indicates bearish momentum (oversold). The key insight: overbought doesn't mean "sell"—strong trends stay overbought for extended periods.
📺 Watch the full RSI course above, or continue reading for the complete breakdown.
💡 Click any timestamp to jump to that section in the article.
RSI measures momentum (direction + speed), moving between 0-100. Above 70 = strong bullish momentum, below 30 = strong bearish momentum.
The biggest RSI mistake: treating overbought as a sell signal. Strong trends stay overbought for extended periods—don't fight them.
RSI works differently in trends vs. ranges. In trends, use RSI for continuation. In ranges, use overbought/oversold for mean reversion.
RSI divergence (when price and RSI disagree) is one of the most powerful reversal signals—combine with price action for best results.
Use RSI length 7-9 for day trading, 14-21 for swing trading. Adjust bands to 80/20 for stronger signals in trending markets.
The RSI measures momentum on a 0-100 scale. Above 70 = overbought (strong bullish momentum). Below 30 = oversold (strong bearish momentum).
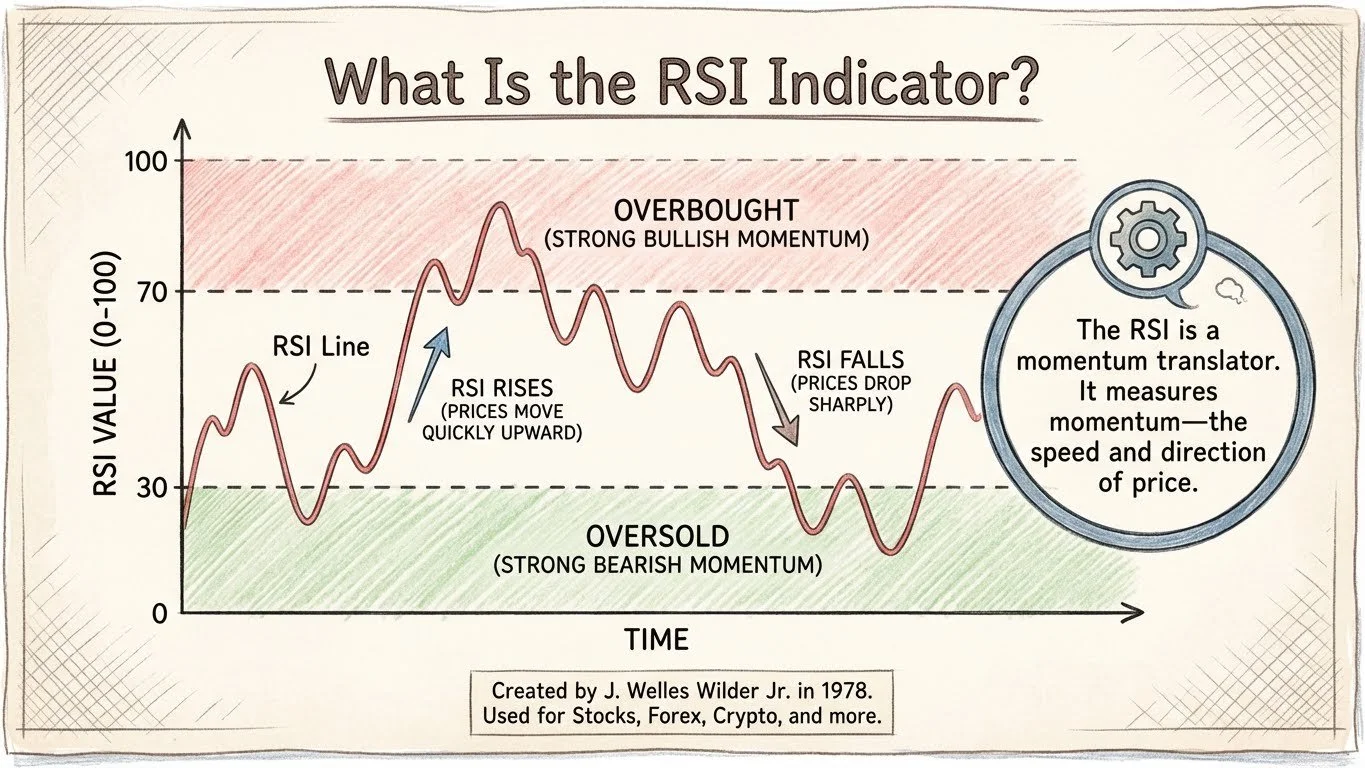
The RSI (Relative Strength Index) is a momentum indicator that translates price action into a single line moving between 0 and 100. Created by J. Welles Wilder Jr. in 1978, it remains one of the most widely used technical analysis tools for trading stocks, forex, crypto, and other financial markets.
The core principle is straightforward: the RSI measures both the direction and speed of price movements. When prices move quickly upward, RSI rises. When prices drop sharply, RSI falls. This makes it a "momentum translator" that helps traders gauge the strength behind any price move.
Most of the time, RSI oscillates between 30 and 70. Values above 70 indicate overbought conditions (strong bullish momentum), while values below 30 signal oversold conditions (strong bearish momentum).
"The RSI is a momentum translator. It measures momentum—the speed and direction of price."
Before mastering RSI, you need to understand what momentum actually means. In trading, momentum = direction + speed.
Strong momentum occurs when price moves fast and violently in one direction. You'll see large candles with little hesitation. Weak momentum appears as slow, grinding price action with mixed candle colors and smaller bodies.
There are four momentum states to recognize:
Strong Bullish Momentum: Large green candles, fast upward movement, little hesitation. RSI typically pushes above 70.
Weak Bullish Momentum: Small green candles, slow grinding higher, possibly mixed with small red candles. RSI stays moderate.
Strong Bearish Momentum: Large red candles, fast downward movement, violent selling. RSI drops below 30.
Weak Bearish Momentum: Small red candles, slow decline, possibly mixed with small green candles. RSI stays moderate but below 50.
Neutral Momentum: Sideways price action where neither bulls nor bears control the market.
Identifying momentum candles becomes second nature for experienced traders, but beginners benefit from strict mechanical rules.
The Bullish Momentum Pattern Rule:
A bullish momentum candle has a real body (the filled portion between open and close) that is more than twice the size of the previous three candles. Ideally, look for candles three to four times larger than recent price action.
This rule removes subjectivity. When you see a candle that dwarfs recent price action, that's momentum announcing itself. The larger the candle relative to recent history, the stronger the momentum signal.
"I have a rule for myself to spot momentum candles—the real body should be more than twice the size of the previous three candles. Preferably three times or even four times as large."
The RSI line moves between 0 and 100, with most price action keeping it between 30 and 70.
Key RSI Levels:
Above 70 (Overbought): Strong bullish momentum. The market has been moving up aggressively.
Below 30 (Oversold): Strong bearish momentum. The market has been selling off aggressively.
At 50 (Midline): Neutral zone. Neither bulls nor bears have clear control.
How to Read RSI:
The higher the RSI, the stronger the recent bullish momentum. An RSI of 80 indicates more aggressive buying than an RSI of 60. Conversely, lower RSI values indicate stronger bearish momentum—an RSI of 20 shows more aggressive selling than an RSI of 40.
Here's where most traders get RSI completely wrong: treating overbought as a sell signal and oversold as a buy signal.
This seems logical on the surface. If something is "overbought," shouldn't you sell? If it's "oversold," shouldn't you buy?
No. And this mistake costs traders significant money.
The reality is counterintuitive: the best trending moves happen when RSI stays overbought or oversold for extended periods.
Consider a strong uptrend. During the most profitable phase—when price is surging higher day after day—RSI will often remain above 70 for weeks. If you sold every time RSI hit 70, you'd miss the entire move.
"Overbought does not mean price must fall. Oversold does not mean price must rise. Using overbought as a sell signal and oversold as a buy signal is one of the biggest RSI mistakes I see."
The strongest trends keep RSI elevated (in uptrends) or depressed (in downtrends). Overbought and oversold are momentum conditions, not trade signals.
RSI behaves differently depending on whether the market is trending or ranging. This distinction is critical.
In Trending Markets:
Use RSI with a continuation bias. In uptrends, RSI will stay elevated—often above 50, frequently above 70. This is normal and healthy. Don't fight it.
In downtrends, RSI will stay depressed—often below 50, frequently below 30. Again, this confirms trend strength rather than signaling reversals.
In Ranging Markets:
RSI becomes a mean reversion tool. When price bounces between support and resistance without trending, overbought and oversold conditions actually matter.
In a range, RSI above 70-80 suggests price is near the top of the range and may pull back. RSI below 20-30 suggests price is near the bottom and may bounce.
The Critical Question:
Before using any RSI signal, ask: "Is this market trending or ranging?"
If trending, use RSI to confirm trend strength and find continuation entries. If ranging, use overbought/oversold to anticipate mean reversion.
Choose the right approach based on market context
Look at higher timeframe structure + RSI position relative to 50
Practice identifying market regimes on live charts
TradingView's multi-timeframe analysis makes regime identification easy
When you've identified a clear trading range—price bouncing between defined support and resistance—RSI becomes a powerful mean reversion tool.
How It Works:
In a range, price tends to snap back toward the middle. When RSI reaches extreme levels (above 80 or below 20) while price tests range boundaries, the probability of reversal increases.
Example Setup:
Price approaches range resistance while RSI pushes above 80. You see a bearish candlestick pattern (like an engulfing pattern or evening star) form at resistance. This creates confluence: range resistance + extreme RSI + bearish price action.
Entry comes at the candle close. Stop-loss goes just above the high. Target is the range midpoint or support.
Critical Warning:
If you see strong momentum breaking through the range boundary—large candles with conviction—the range may be breaking down. Don't blindly fade breakouts. Wait for price to show rejection before entering mean reversion trades.
The 50 level on RSI acts as a trend bias filter that can dramatically improve your trading.
The Rule:
In uptrends, RSI should stay above 50 most of the time. Brief dips below 50 during pullbacks are acceptable, but RSI should quickly recover. If RSI drops below 40 and stays there, the uptrend is weakening.
In downtrends, RSI should stay below 50 most of the time. Brief spikes above 50 during bounces are acceptable, but RSI should quickly fall back. If RSI rises above 60 and holds, the downtrend is weakening.
Practical Application:
When looking for trend continuation entries (like buying pullbacks in an uptrend), check RSI. If RSI is above 50 or at least above 40, the trend bias supports your trade. If RSI has collapsed below 40, the trend may be exhausted—wait for confirmation before entering.
"Strong trends will have RSI above the 50 level. We can use the RSI and the 50 line to help us filter bad trades."
RSI doesn't always oscillate around 50. In strong trends, the entire RSI range shifts higher or lower.
Bullish Regime:
In strong uptrends, RSI finds higher floors. Instead of bouncing between 30 and 70, it might oscillate between 40 and 80. Each pullback in RSI makes a higher low than the previous pullback.
This is a sign of trend strength. As long as RSI keeps making higher lows, bulls remain in control.
Bearish Regime:
In strong downtrends, RSI finds lower ceilings. Instead of bouncing between 30 and 70, it might oscillate between 20 and 60. Each rally in RSI makes a lower high than the previous rally.
Warning Signs:
When RSI breaks its pattern of higher lows (in an uptrend) or lower highs (in a downtrend), the trend may be weakening. This doesn't guarantee reversal, but it's a signal to pay closer attention and potentially tighten stops.
"If the RSI breaks below the previous low in an uptrend, this is a warning sign that the uptrend is getting weaker—or we might be entering a consolidation phase."
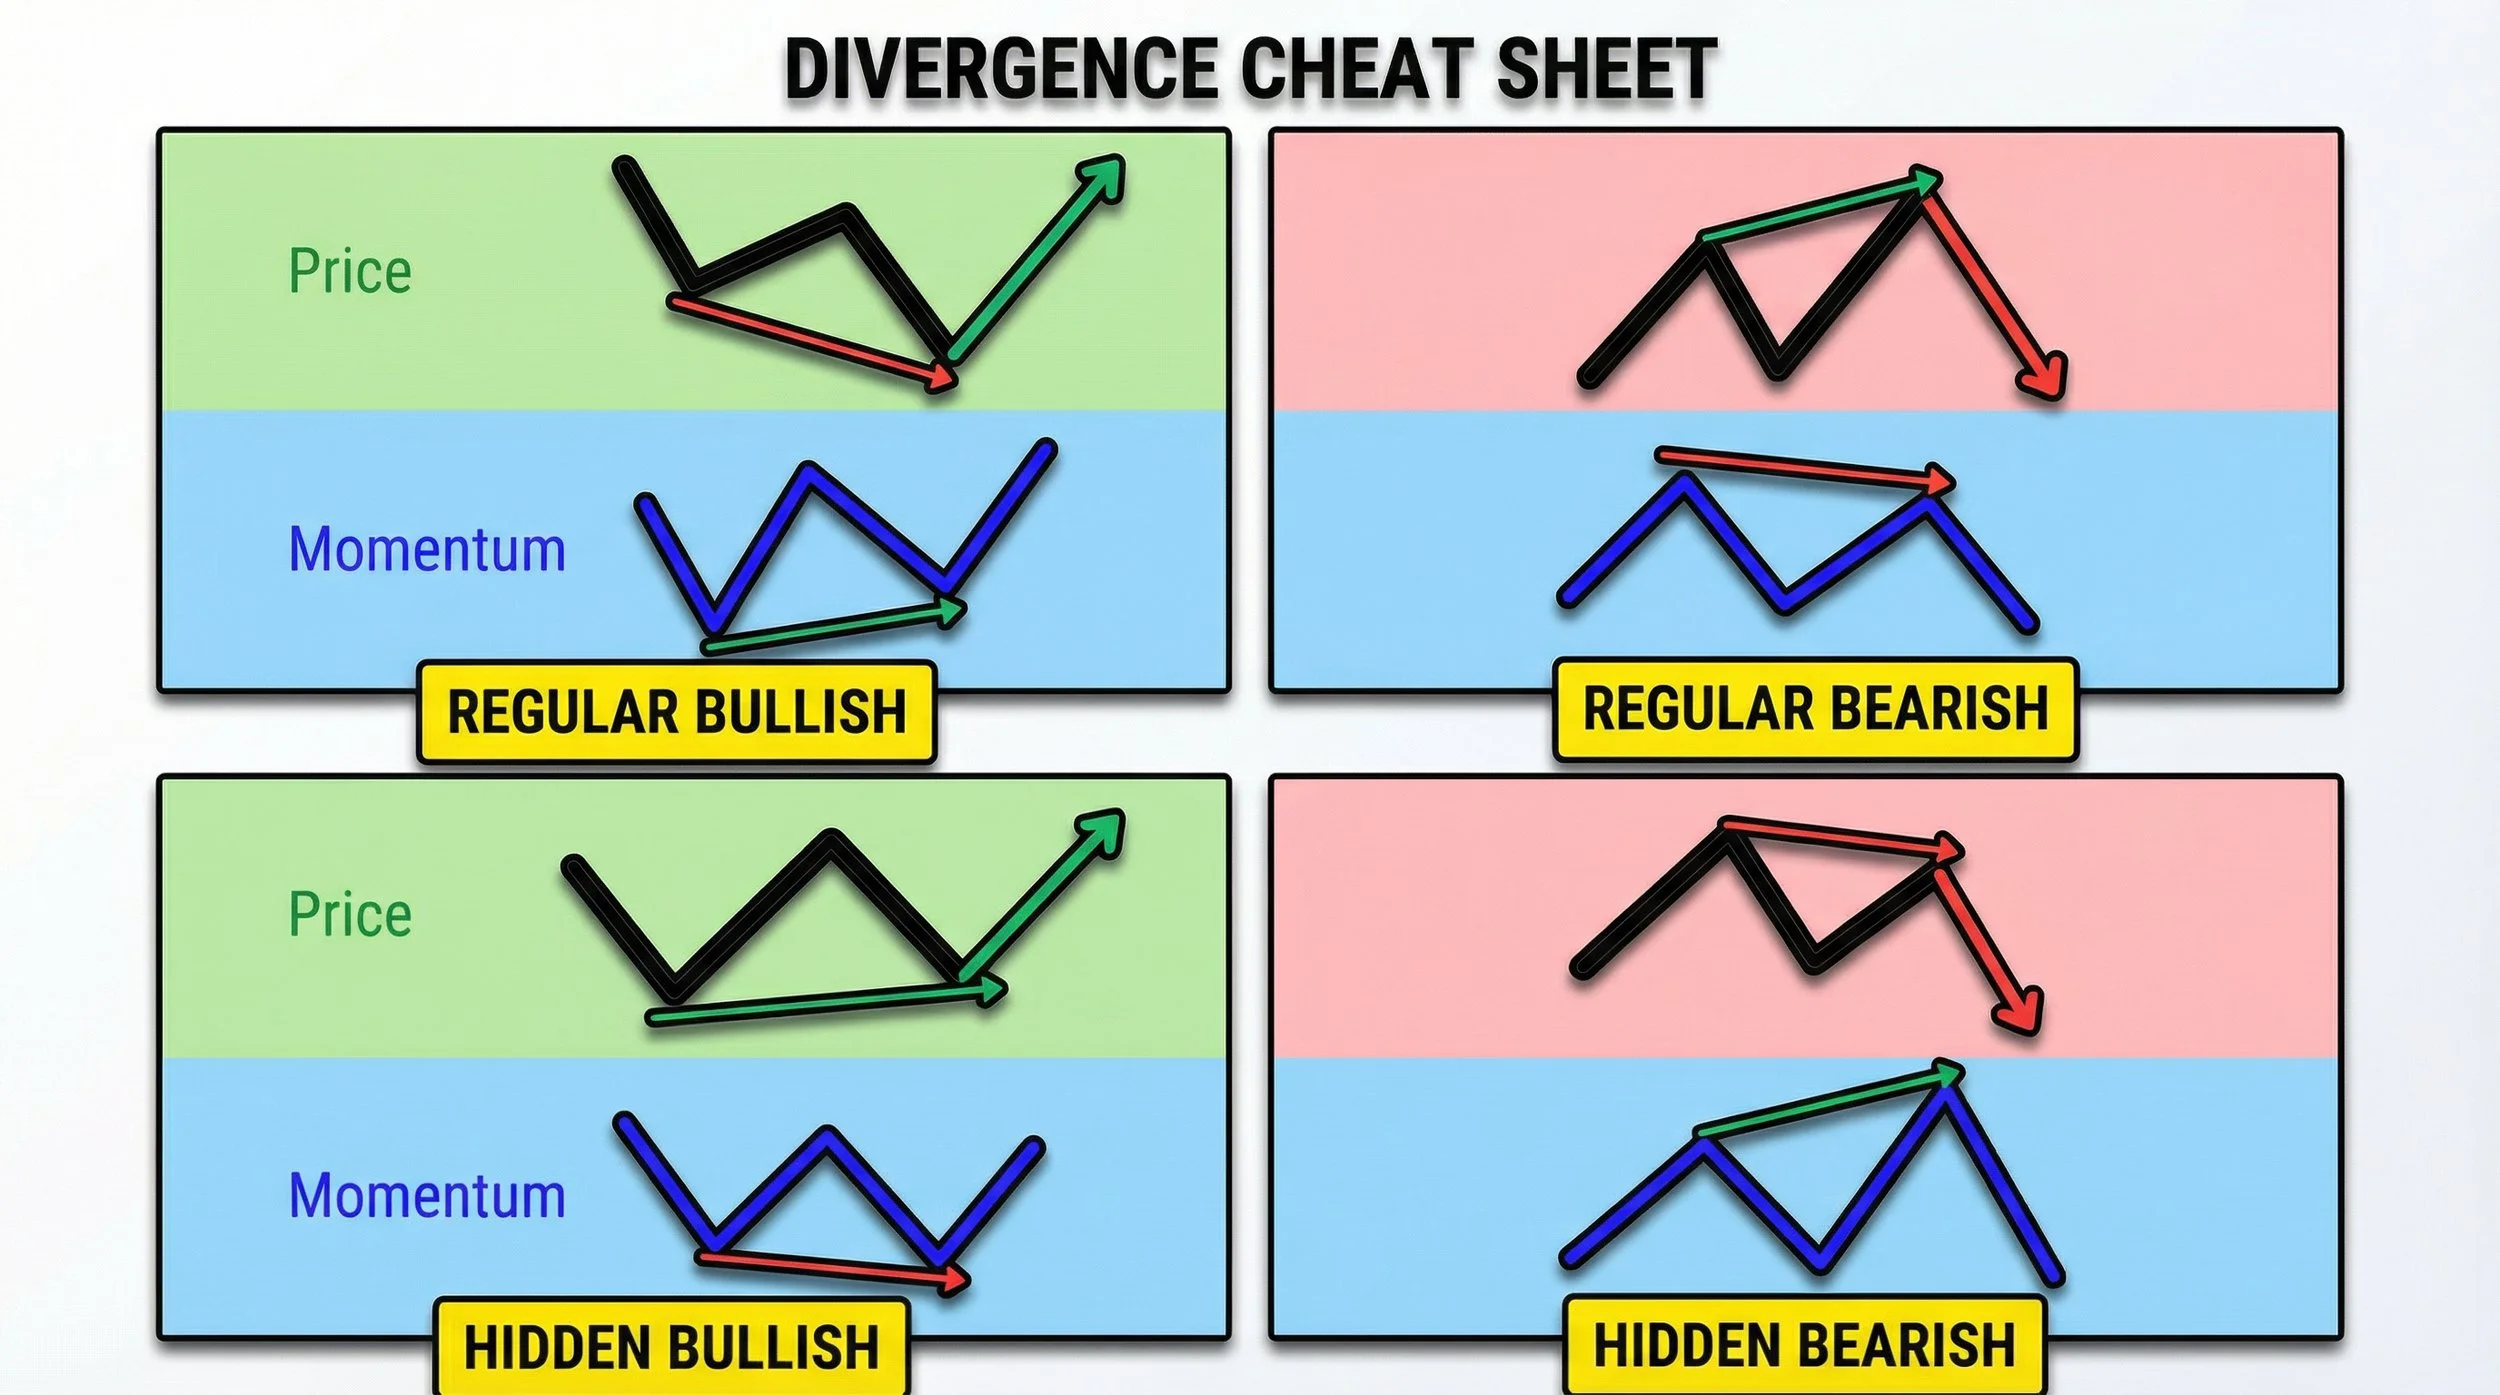
RSI Divergence Cheat Sheet - Regular and Hidden Divergence Patterns
RSI divergence occurs when price and RSI disagree—price moves one direction while RSI moves the opposite direction. This disagreement often precedes reversals.
There are four types of RSI divergence:
Regular Bullish Divergence:
Price makes a lower low, but RSI makes a higher low. This suggests selling pressure is weakening despite price making new lows. It indicates a potential reversal to the upside.
Regular Bearish Divergence:
Price makes a higher high, but RSI makes a lower high. This suggests buying pressure is weakening despite price making new highs. It indicates a potential reversal to the downside.
Hidden Bullish Divergence:
Price makes a higher low, but RSI makes a lower low. This occurs during uptrends and suggests the trend will continue higher. It's a continuation signal, not a reversal signal.
Hidden Bearish Divergence:
Price makes a lower high, but RSI makes a higher high. This occurs during downtrends and suggests the trend will continue lower. It's a continuation signal, not a reversal signal.
Quick Reference:
For bullish divergences (both regular and hidden), always compare the lows. For bearish divergences (both regular and hidden), always compare the highs.
→ Potential reversal UP
→ Potential reversal DOWN
→ Trend continues UP
→ Trend continues DOWN
Quick Tip: For bullish divergences, compare the lows. For bearish divergences, compare the highs.
Divergence alone isn't enough for high-probability trades. Combine divergence with price action confirmation.
Step 1: Identify Divergence
Spot the disagreement between price and RSI. Use TradingView's built-in divergence detection (Settings → Inputs → Calculate Divergence) to help identify setups.
Step 2: Wait for Confirmation
Don't enter on divergence alone. Wait for a candlestick pattern that confirms the reversal: engulfing patterns, pin bars, morning/evening stars, or other reversal signals.
Step 3: Check Context
Is divergence forming at a significant level? Key support/resistance, previous swing highs/lows, and round numbers add confluence. Divergence at random price levels is less reliable than divergence at key levels.
Step 4: Define Your Trade
Set a clear entry (usually at candle close after confirmation), stop-loss (beyond the recent swing high/low), and profit target (previous structure or risk-based target).
"Not all divergences will play out right away. In order to trade divergences, you want to combine divergences with price action and market structure."
The default RSI setting is 14 periods, but different timeframes and trading styles benefit from adjustments.
For Day Trading (Shorter Timeframes):
Use RSI length of 7 to 9 periods. This makes RSI more responsive to recent price action, which is important when trading 1-hour charts or lower.
To adjust in TradingView: Click the settings cog on RSI → Inputs → Change RSI Length to 7.
For Swing Trading (Daily Charts and Higher):
Use RSI length of 14 to 21 periods. The standard 14 works well, but 21 periods smooths out noise and shows more significant momentum shifts.
A 21-period RSI tends to stay above 50 throughout strong trends more consistently, making it easier to identify when trends are truly intact.
Adjusting Overbought/Oversold Levels:
For stronger signals in trending markets, change the bands from 70/30 to 80/20. This filters out minor overbought/oversold readings and highlights only extreme momentum.
To adjust: Settings → Style → Change Upper Band to 80, Lower Band to 20.
Enabling Divergence Detection:
TradingView can automatically mark divergences. Settings → Inputs → Check "Calculate Divergence."
Choose the right period for your trading style
Test different RSI settings side by side
TradingView lets you overlay multiple RSI indicators to compare settings
For identifying extreme RSI readings with statistical significance, enable Bollinger Bands on your RSI.
To enable: Settings → Inputs → Check "RSI-based MA" and "SMA + Bollinger Band."
This adds a moving average and standard deviation bands around the RSI line. When RSI pierces outside these bands, it's behaving abnormally—a potential signal to watch.
How to Use It:
When RSI spikes above the upper Bollinger Band, momentum is abnormally strong. This often precedes pullbacks or reversals.
When RSI drops below the lower Bollinger Band, selling is abnormally intense. This often precedes bounces or reversals.
The bands provide statistical context for "extreme" readings rather than relying on fixed 70/30 levels.
RSI is a condition, not an entry signal. Proper risk management turns RSI insights into profitable trades.
Rule 1: RSI Confirms, Price Action Triggers
Use RSI to identify favorable conditions. Use candlestick patterns and price structure for actual entries. Never enter based on RSI alone.
Rule 2: Define Every Trade
Before entering, know your entry price, stop-loss level, and profit target. Calculate position size based on risk per trade (typically 1-2% of account).
Rule 3: Backtest Before Live Trading
Test RSI strategies on historical data before risking real money. TradingView's replay feature and paper trading account let you practice without risk.
Rule 4: Stay Consistent
Follow your rules every trade. Consistency reveals whether your strategy has an edge. Random rule-breaking makes improvement impossible.
"In order to stay in the game, we need to manage our risk. If we can't keep the money we are making, why are we making it in the first place?"
Here's how to combine everything into a complete trade setup:
Step 1: Identify Market Regime
Determine if the market is trending or ranging. This dictates how you'll use RSI.
Step 2: Check RSI Conditions
For trend trades: Is RSI confirming the trend (above 50 in uptrends, below 50 in downtrends)? For reversal trades: Is RSI diverging from price? Is RSI at extreme levels in a range?
Step 3: Find Confluence
Look for multiple signals aligning: RSI condition + candlestick pattern + key price level.
Example: Bearish divergence + evening star pattern + previous resistance = high-probability short setup.
Step 4: Execute with Discipline
Enter at candle close after confirmation. Set stop-loss beyond the recent swing point. Target based on structure (next support/resistance) or risk multiple (1:1, 2:1, etc.).
Step 5: Manage the Trade
Follow your plan. Don't move stops to "give it room." Don't exit early from fear. Let the trade play out according to your predefined rules.
Configure RSI like a pro in under 2 minutes
Open any chart → Click "Indicators" at the top → Search "RSI" → Select the built-in indicator under Technicals
Click the ⚙️ settings cog next to "RSI" in the indicator panel below your chart
New to TradingView?
Get 30 days free premium + $15 bonus when you sign up
TradingView is the recommended platform for RSI analysis. Here's how to configure it:
Adding RSI:
Open any chart
Click "Indicators" at the top
Search "RSI" or "Relative Strength Index"
Select the built-in indicator (under Technicals)
Configuring Settings:
Click the settings cog next to "RSI" in the indicator panel.
Inputs Tab:
RSI Length: 14 (default), 7-9 for day trading, 21 for swing trading
Source: Close (default) or OHLC/4 for smoother readings
Calculate Divergence: Check to auto-detect divergences
Style Tab:
RSI Upper Band: 70 (default) or 80 for stronger signals
RSI Lower Band: 30 (default) or 20 for stronger signals
Uncheck "RSI-based MA" for cleaner display, or enable with Bollinger Bands for advanced analysis
For day trading on shorter timeframes (1-hour charts and below), use an RSI length of 7-9 periods. This makes the indicator more responsive to recent price action, helping you identify momentum shifts faster. The standard 14-period setting works better for swing trading on daily charts.
No—this is one of the most common RSI mistakes. Overbought doesn't mean "sell." In strong uptrends, RSI can stay above 70 for extended periods while price continues rising. Overbought signals momentum strength, not an automatic sell signal. Only use overbought for mean reversion in sideways, ranging markets.
RSI divergence occurs when price and RSI move in opposite directions. For example, price makes a higher high but RSI makes a lower high (bearish divergence). This signals weakening momentum and potential reversal. Trade divergence by waiting for candlestick confirmation (like an engulfing pattern) at key price levels before entering.
Regular divergence signals potential reversals—price makes new highs/lows but RSI doesn't confirm. Hidden divergence signals trend continuation—during an uptrend, price makes a higher low but RSI makes a lower low, suggesting the trend will continue. Regular divergence is for reversals; hidden divergence is for continuations.
Yes, RSI works on any market including crypto. The same principles apply: use shorter periods (7-9) for active day trading, longer periods (14-21) for swing trading. Crypto markets can be more volatile, so RSI may reach extreme levels more frequently. Always combine RSI with price action and proper risk management.
The 50 level acts as a trend bias filter. In uptrends, RSI should stay above 50 most of the time—dips below are acceptable during pullbacks but should recover quickly. In downtrends, RSI stays below 50. If RSI consistently breaks its bias (above 50 in a downtrend or below 50 in an uptrend), the trend may be weakening.
Click the settings cog on your RSI indicator, go to the Inputs tab, and check "Calculate Divergence." TradingView will automatically mark divergences on your chart. Note that not all detected divergences will play out—always wait for price action confirmation before trading.
The RSI indicator is one of the most powerful tools in technical analysis—when used correctly. The key insights from this guide:
Momentum is everything. RSI measures momentum (direction + speed), not overbought/oversold conditions in isolation.
Context determines strategy. In trends, use RSI to confirm strength and find continuation entries. In ranges, use extreme RSI for mean reversion.
Divergence is powerful. When price and RSI disagree, pay attention. Combine divergence with price action for high-probability setups.
Overbought doesn't mean sell. The biggest mistake is selling because RSI is above 70. Strong trends stay overbought for extended periods.
Risk management is non-negotiable. RSI creates conditions, not entries. Combine with proper stop-losses, position sizing, and trade management.
Master these principles, and you'll use RSI like a professional trader—making better decisions and capturing more profitable moves.
Learn to identify trends, ranges, and key turning points that determine RSI context.
Combine Bollinger Bands with RSI for powerful volatility and momentum analysis.
Another powerful momentum indicator that pairs well with RSI for trade confirmation.
Understand how institutional traders move markets and combine with RSI analysis.
Trading & Investing Enthusiast
Teaching traders to understand market psychology, technical analysis, and investing through clear beginner-friendly insights.
Started investing at 16 and became fascinated by how market psychology influences price movements. Still learning something new every day.
Love sharing what I've learned along the way. There's nothing quite like helping someone understand a concept that once confused me too.
Proud to have built a community where traders actively share insights and grow together through daily market analysis and discussion.
Want to join our learning journey?
Spot divergences, overbought/oversold zones & momentum shifts in real-time
TradingView
Configure RSI with custom settings, auto-detect divergences & add Bollinger Bands
30 Days Free + $15Bybit
Practice RSI divergence & mean reversion strategies on crypto markets
Up to $30K BonusInvestingPro
Screen for oversold stocks with bullish RSI divergence setups
Save 55% Today