
Smart Money Concepts: The Ultimate Guide
Now that you know TradingView, learn how institutional traders move markets.
TradingView is a powerful web-based charting platform used by millions of traders to analyze stocks, crypto, and forex markets. To get started, create a free account at tradingview.com, open a chart via Products → Super Charts, then use drawing tools and indicators to analyze price action. This complete 2026 guide covers everything from basic setup to advanced features like alerts, replay mode, and paper trading.
📺 Prefer video? Watch the full TradingView 2026 tutorial above. Prefer reading? Keep scrolling for the complete written guide with bonus tips.
💡 Click any timestamp to jump to that section in the article.
TradingView's free plan is sufficient for beginners—upgrade only when limitations become frustrating
Always search for ticker symbols (BTC, TSLA) rather than full names for more accurate chart results
Master four essential indicators: Volume, Moving Averages, RSI, and ATR to analyze any market
Use the Long/Short Position tool to plan every trade with proper risk-to-reward ratios before entering
Practice with Paper Trading and Replay Mode before risking real money—this builds skill without financial risk
Set alerts on price levels and indicators so you never miss important trading setups
Whether you're completely new to trading or you've been using TradingView for a while but feel overwhelmed or disorganized, this guide will give you a clean setup and clear workflow that actually makes sense.
"I've been using TradingView for over seven years now. So I'm super familiar with the platform and I really enjoy teaching. My goal here is ambitious, but I will try my very best to make this the best TradingView tutorial on YouTube."
This comprehensive course covers everything step-by-step: account setup, understanding the interface, opening your first chart, navigation, drawing tools, indicators, alerts, replay mode, and paper trading. If you're a beginner, watch from start to finish. If you're more advanced, use the video chapters above to jump to what you need.
To access TradingView, simply go to tradingview.com. You can also download the TradingView desktop app or mobile app, but this tutorial focuses on the web browser version (which also applies to the desktop app).
💡 Start with Free, upgrade when limitations become frustrating.
Try Premium Free for 30 Days + Get $15 Bonus →Before doing anything else, you need to sign up for TradingView. If you don't sign up, you'll get annoying popups that can actually delete your work.
Important: TradingView has a free plan that's actually pretty good. For most beginners, I recommend starting with the free plan.
Click the "Get Started" button in the top right corner
Choose to sign up with Google (fastest) or email
You'll be taken to the plans page
My recommendation for beginners: Start with the free version. Then if limitations become annoying—too many ads, need more indicators, want more charts—wait to upgrade until you actually hit that point.
If you want to try premium features, you can use a free 30-day trial. I have a special link that gives you the trial plus a $15 bonus when you eventually decide to upgrade:
When you first sign in, your screen should show your profile picture in the corner (initially just a letter of your name). I'm recording this tutorial on the free version so I can show features everyone has access to.
The main elements you'll see:
Your profile - Upper right corner
Watch list - Tab on the right side (where you add assets to track)
Navigation bar - Top of screen with Products, Markets, etc.
To open your first chart:
Go to Products in the top menu
Click Super Charts
A candlestick chart will appear
A candlestick chart shows price movement with red and green bars. In the upper left corner, you'll see:
The symbol (e.g., BTCUSD for Bitcoin)
The timeframe (e.g., "D" for daily)
Each candlestick represents one period of price movement. On a daily timeframe, each candle = one day. The red/green "body" shows open and close prices, while the thin "wicks" above and below show the high and low reached.
To change the timeframe, look for buttons at the bottom of the chart:
5m = 5 minutes per candle
1h = 1 hour per candle
1D = 1 day per candle
1W = 1 week per candle
Day traders typically use shorter timeframes (5m-1h), while swing traders and investors use longer ones (4h-1W).
To find any market, use the Symbol Search at the top of the chart.
Always search for ticker symbols, not full names.
Bitcoin → Search BTC (not "Bitcoin")
Tesla → Search TSLA (not "Tesla")
Apple → Search AAPL (not "Apple")
Why? You'll get better, more accurate results. If you don't know a ticker symbol, just Google "[Company name] ticker symbol" or ask ChatGPT.
When you search for BTC, you'll see multiple results like:
BTCUSD on Bitstamp
BTCUSD on Coinbase
BTCUSD on Binance
This is because the same asset trades on different exchanges. Each exchange shows slightly different prices due to liquidity differences. For most analysis, any major exchange works fine.
Mastering navigation will save you hours of frustration.
Vertical axis (price):
Left-click on the price axis (right side)
Hold and drag up/down to zoom
Horizontal axis (time):
Use your mouse scroll wheel
Or left-click and drag on the time axis at the bottom
Hold left-click anywhere on the chart and drag to pan around
You can zoom while dragging for quick navigation
Save time with these essential hotkeys
💡 Pro tip: Press Ctrl + C on a trend line, then Ctrl + V to duplicate it with the exact same angle—perfect for drawing parallel channels.
At the bottom right, you'll see an "Auto" checkbox. When enabled, the chart automatically adjusts zoom as you scroll through time. Some traders find this helpful; I personally prefer manual control.
This is important to understand, especially for crypto and long-term analysis.
On a linear scale, equal distances = equal dollar amounts. A move from $0 to $10,000 looks the same as $90,000 to $100,000.
Problem: On long-term charts, early price movements become invisible because they're tiny compared to recent prices.
On log scale, equal distances = equal percentage moves. A 50% gain looks the same whether it's from $100 to $150 or $10,000 to $15,000.
When to use log scale:
Long-term charts (weekly, monthly)
Assets that have grown significantly (like Bitcoin from $1 to $100,000)
When to use linear scale:
Day trading and short-term analysis
Most typical trading situations
To toggle: Look for the "Log" checkbox near the bottom right of your chart.
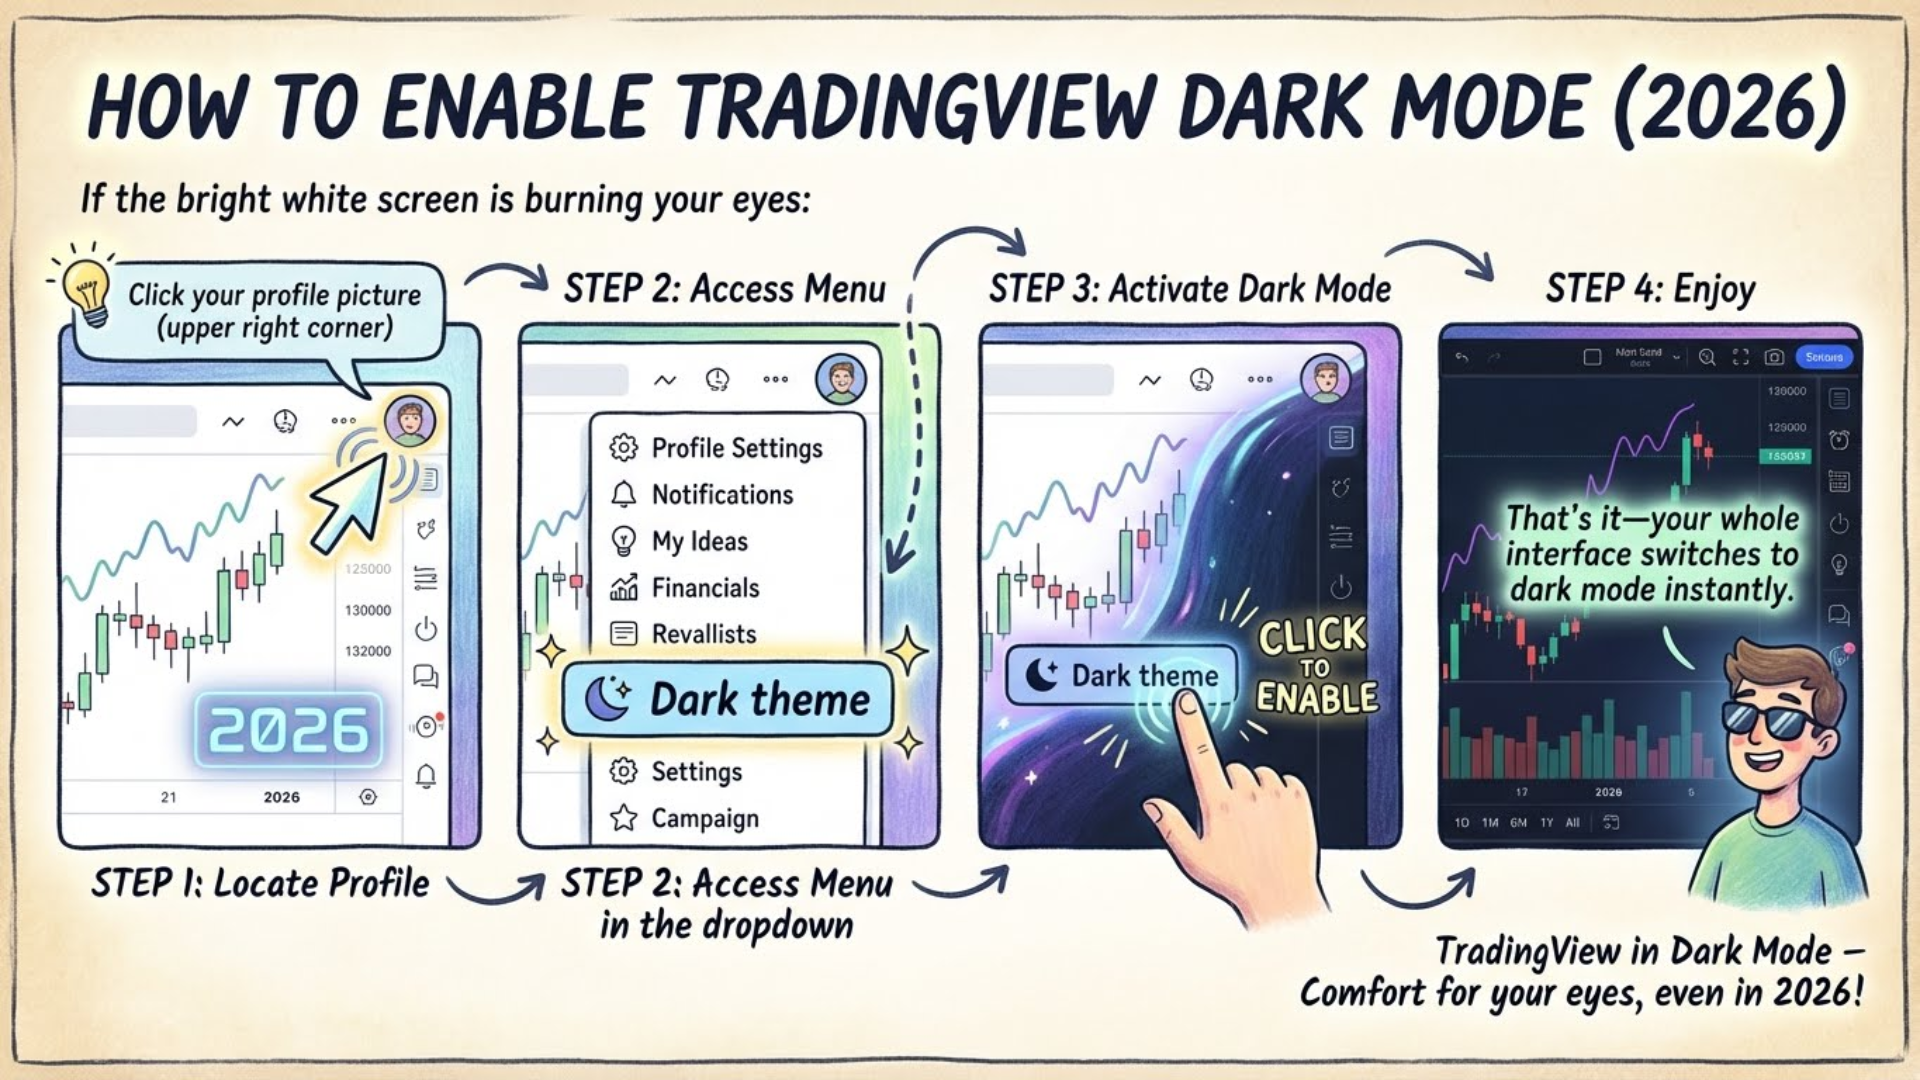
Enable TradingView dark mode in seconds: Profile → Menu → Dark theme → Done
If the bright white screen is burning your eyes:
Click your profile picture (upper right corner)
Find "Dark theme" in the dropdown
Click to enable
That's it—your whole interface switches to dark mode instantly.
To customize your chart appearance:
Right-click anywhere on the chart
Select "Settings"
Go to the "Symbol" tab to change candle colors
Go to "Canvas" tab for background, gridlines, etc.
Popular customizations:
Candle colors: Some traders prefer white/black instead of green/red
Background: Solid color or gradient
Gridlines: Enable or disable horizontal/vertical lines
Remember, you'll spend a lot of time in TradingView, so make it comfortable for your eyes. You can always click "Apply Defaults" to reset everything.
The left sidebar contains all drawing tools for analyzing charts. Let me show you the essential ones.
Trend Line Tools → Horizontal Line
The horizontal line is the most basic tool for marking support and resistance levels. To use it:
Select "Trend line tools" from the left sidebar
Choose "Horizontal line" (or press Alt+H)
Click anywhere on the chart to place it
You can customize line thickness and color by clicking on the line → Settings → Style.
While many traders use horizontal lines, I actually prefer rectangles for support and resistance because real markets rarely respect perfect lines—they respect zones.
Go to "Geometric shapes" in the left toolbar
Select "Rectangle"
Click twice to define the zone boundaries
This gives you a range rather than a precise line, which is more realistic.
"Support and resistance are many times—in real markets, they are never perfect lines. They are more often support and resistance zones. For this reason, I prefer to draw out zones rather than perfect lines."
Trend Line Tools → Trend Line
Trend lines help identify directional movements and chart patterns.
To draw a trend line:
Select "Trend line" from the toolbar
Click on the first point (usually a low or high)
Click on the second point
Pro tip: To copy a trend line with the same slope:
Click on the trend line
Press Ctrl+C, then Ctrl+V
The new line maintains the exact same angle
This is useful for drawing parallel channels or identifying patterns like bull flags.
Gann and Fibonacci Tools → Fib Retracement
The Fibonacci retracement is one of the most popular tools for identifying potential reversal levels.
How to use it:
Select "Fib retracement" from the toolbar
Click on a swing low
Drag to the swing high (or vice versa)
The tool automatically draws horizontal levels at key Fibonacci ratios: 0.236, 0.382, 0.5, 0.618, and 0.786.
These numbers are percentages—0.382 means 38.2% retracement from the swing. Price often bounces at these levels, especially 0.382 and 0.618.
"Most of the times the price will end in this area right here. You can see in this case we saw this move—the price came down and just touched the 0.382 level before we saw the next impulsive move to the upside."
A few more useful tools from the geometric shapes menu:
Brush: For freehand annotations and marking multiple highs/lows
Path: Draw a predicted price path
Text: Add notes directly on the chart
To add text:
Select "Text" from annotation tools
Click where you want the text
Type your note (e.g., "Significant resistance")
Adjust font size as needed
Now we get to the fun part—indicators. Click the Indicators button at the top of the chart (next to the timeframe selector).
TradingView has tons of built-in indicators, plus thousands created by the community. You'll see:
Technicals: Official TradingView indicators
Community Scripts: User-created indicators (often marked with usage numbers like "75,000")
For beginners, I recommend sticking with built-in indicators until you understand the basics.
Note: On the free plan, you can only have 2 indicators per chart. Essential allows 5, Premium allows 10+.
What it measures: How much was traded during each candle
How to use: High volume = more significant moves. Confirms breakouts and reversals.
What it measures: Average price over X periods
How to use: Price above MA = uptrend. Below = downtrend. Use as dynamic support/resistance.
What it measures: Momentum (speed/strength of price movement)
How to use: Above 70 = overbought, below 30 = oversold. Look for divergences.
What it measures: Volatility (how much price moves on average)
How to use: High ATR = wide stop-loss. Low ATR = tighter stop-loss. Great for position sizing.
💡 Pro tip: Keep indicator settings consistent (e.g., all using 14 or 21 periods) for cleaner analysis.
⚠️ Free plan only allows 2 indicators per chart. Need more?
Unlock 5+ Indicators with Premium Trial →Search for "Volume" and add the basic volume indicator.
Each bar represents how much was traded during that candlestick. On a Bitcoin daily chart, it shows how many BTC changed hands that day.
To see exact numbers, hover over a candle and look at the upper left where it says "V" followed by the volume.
Higher volume = more significant moves.
For example, if you see a hammer candlestick (bullish pattern) with high volume, that's a stronger signal than the same pattern with low volume. Volume confirms the conviction behind price moves.
"If we have a hammer with little volume, it's still bullish but not super bullish. But if we have a hammer and we have lots of volume, the signal becomes more clear, the signal becomes more bullish."
Search for "Moving Average" and add the SMA (Simple Moving Average).
Click the gear icon on the indicator to access settings:
Length: How many candles to average (common values: 20, 50, 200)
Style: Line color and thickness
Moving averages help identify trend direction:
Price above MA = Generally bullish/uptrend
Price below MA = Generally bearish/downtrend
Price crossing the MA = Potential trend change
Warning: In sideways/choppy markets, price will cross the MA repeatedly, generating false signals. Moving averages work best in trending markets.
Search for "RSI" or "Relative Strength Index."
RSI measures momentum—the speed and strength of price movement. It oscillates between 0 and 100.
Above 70: Overbought (may be due for a pullback)
Below 30: Oversold (may be due for a bounce)
One of my favorite RSI strategies is looking for divergences:
Bearish divergence: Price makes higher high, RSI makes lower high
Bullish divergence: Price makes lower low, RSI makes higher low
Divergences can signal potential reversals before they happen.
In settings, you can:
Change the length (default 14)
Adjust colors and line thickness
Remove the RSI moving average (I usually disable this for cleaner charts)
Search for "ATR" or "Average True Range."
ATR measures volatility—how much price moves on average per candle.
High ATR: Large candles, volatile market
Low ATR: Small candles, quiet market
ATR is incredibly useful for:
Stop-loss placement: In high volatility (high ATR), use wider stop-losses. In low volatility, use tighter ones.
Position sizing: Adjust position size based on current volatility
Identifying market conditions: Know when markets are active vs. quiet
"When the ATR is high and when the price moves a lot, you might want to use a little bit wider stop-loss. But when we have smaller movements like when we have right here, we have small movements, we have low ATR, then we might want to have a smaller stop-loss."
Pro tip: Keep indicator settings consistent. If your RSI uses 14 periods, consider using 14 for ATR too. This creates consistency in your analysis.
The 4 essential indicators every trader should know
This tool is essential for planning trades with proper risk management.
Find it in: Forecasting and Measurement Tools → Long Position / Short Position
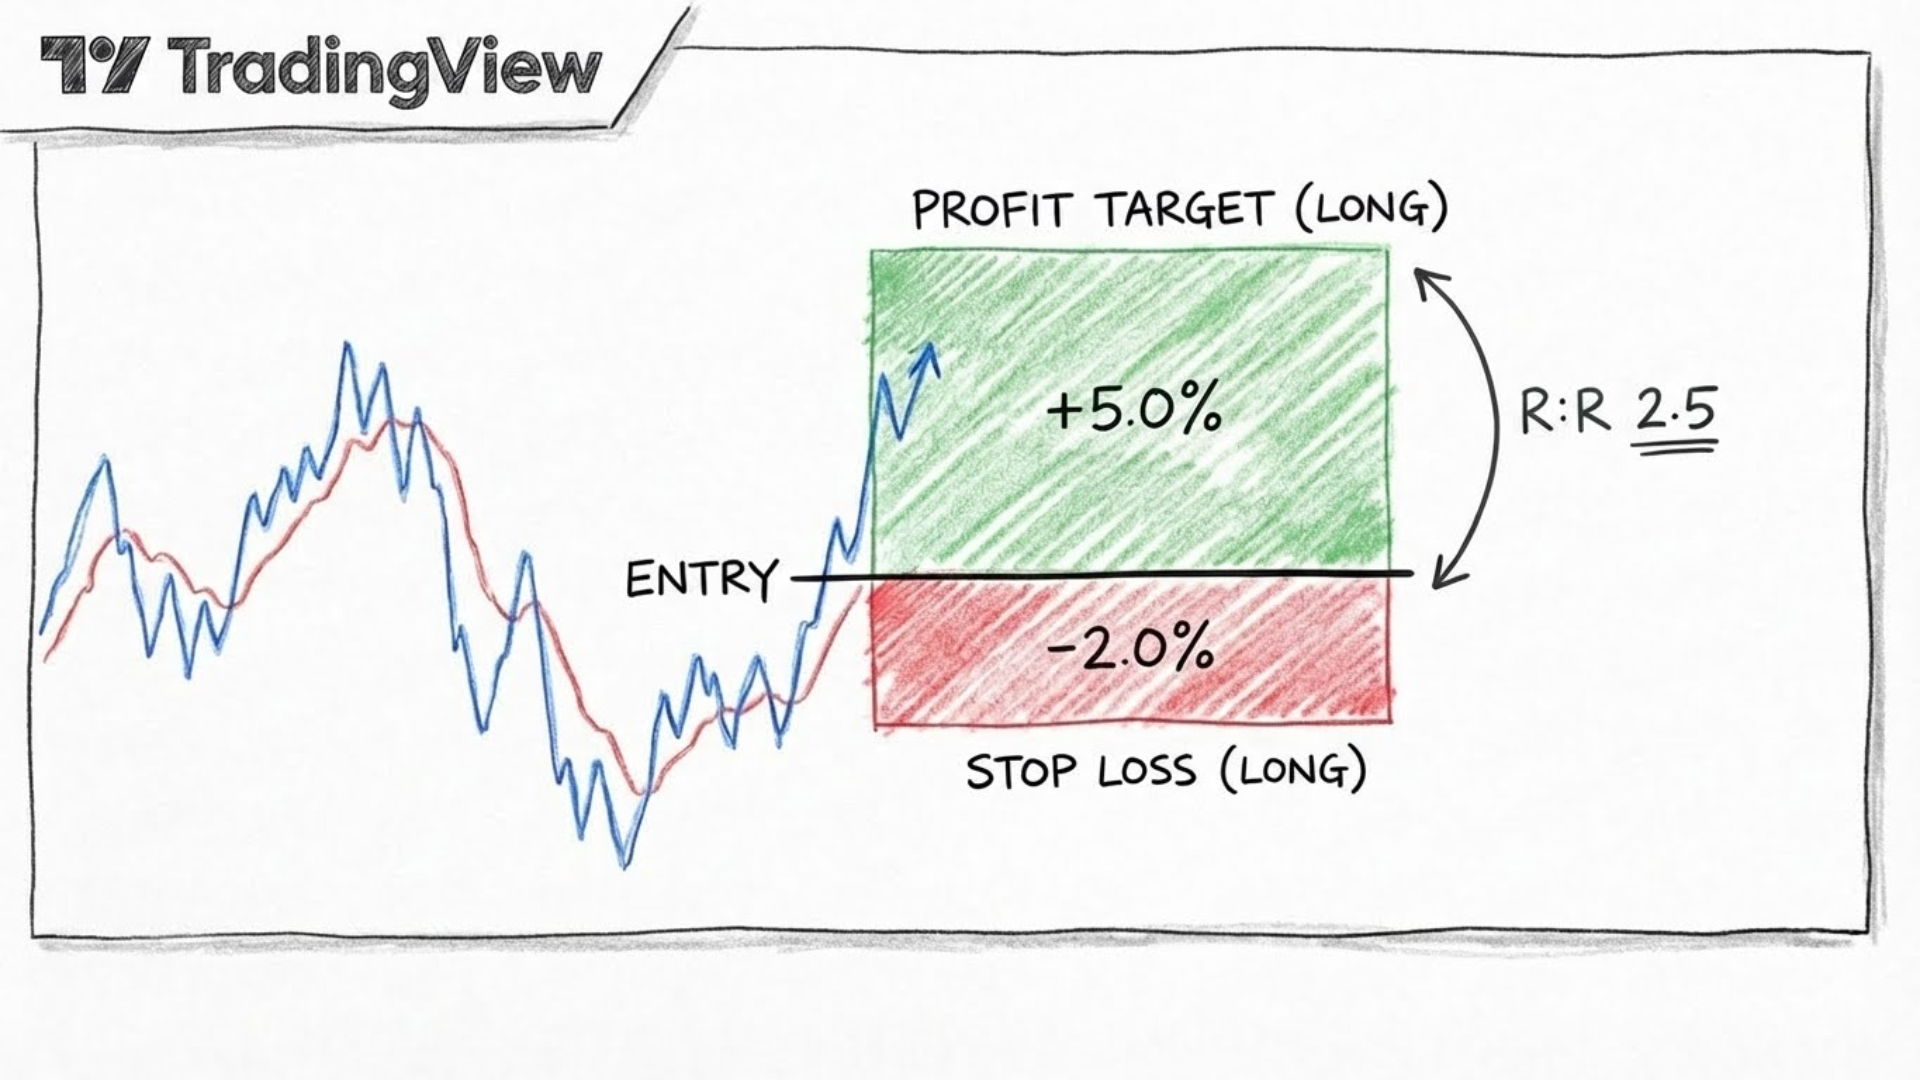
The Long Position tool visualizes your risk (red) vs reward (green). This example shows a 2.5:1 R:R ratio.
Select "Long position"
Click where you would enter the trade
A green area (take profit) and red area (stop loss) appear
Drag them to set your levels
The tool automatically calculates your risk-to-reward ratio. A ratio of 2 means your target is twice the distance of your stop-loss.
Same process, but for betting the price will fall:
Stop-loss goes above your entry
Take-profit goes below your entry
Planning your exit BEFORE entering a trade is crucial for:
Removing emotion from decisions
Consistent risk management
Knowing exactly how much you risk on each trade
"Having a take-profit and a stop-loss is so so important especially as a new trader but even if you are an advanced trader. Pretty much everyone uses stop-loss and take-profit so that the price automatically buys or sells."
Never miss an important price movement again by setting alerts.
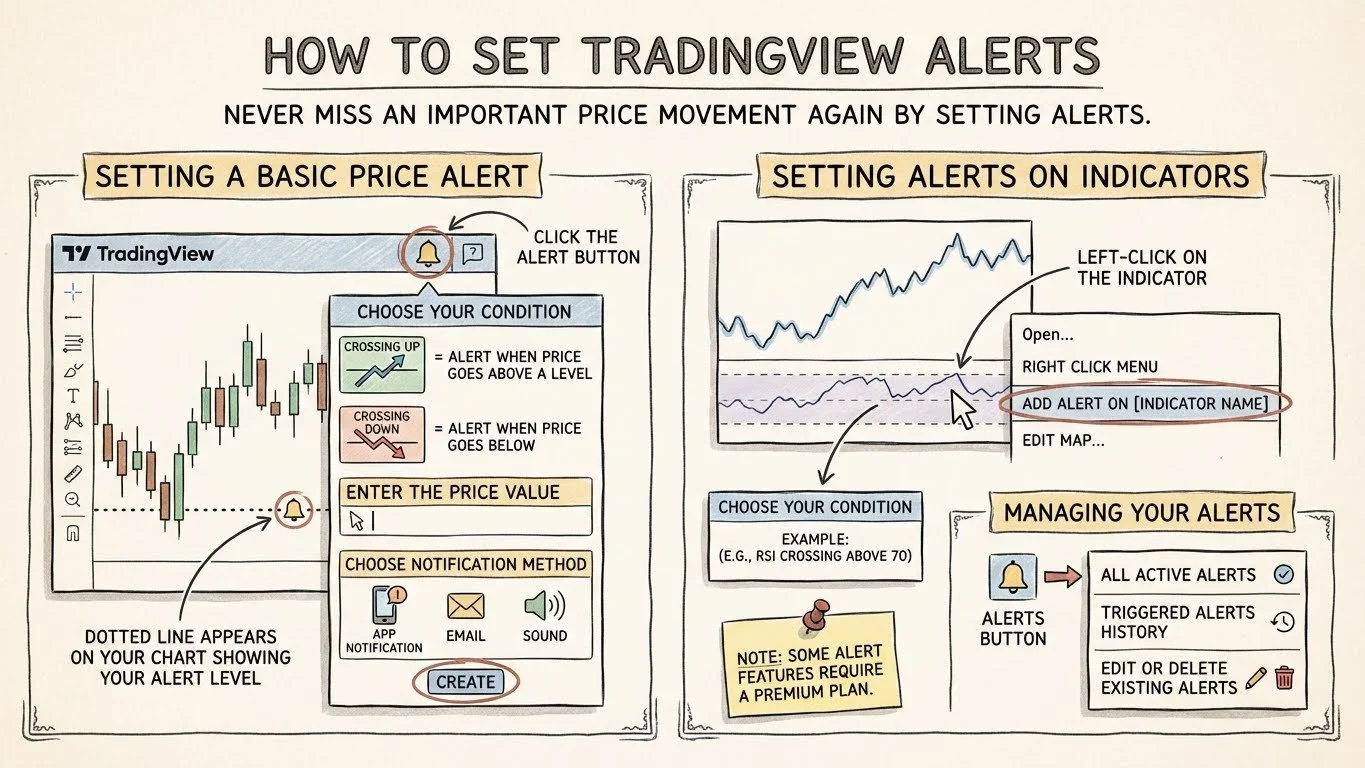
Set TradingView price alerts (left) or TradingView indicator alerts (right) to never miss a trading setup. Manage all alerts from the bell icon.
Click the Alert button (bell icon at top)
Choose your condition:
"Crossing up" = Alert when price goes above a level
"Crossing down" = Alert when price goes below
Enter the price value
Choose notification method (app notification, email, sound)
Click "Create"
A dotted line appears on your chart showing your alert level.
You can also set alerts when indicators reach certain values:
Left-click on the indicator
Right-click and select "Add alert on [indicator name]"
Choose your condition (e.g., RSI crossing above 70)
Note: Some alert features require a premium plan.
Click the Alerts button to see:
All active alerts
Triggered alerts history
Edit or delete existing alerts
Replay mode lets you practice trading on historical data—essential for developing skills without risking money.
Click the Replay button (next to Alerts)
A blue vertical line appears
Click anywhere in the past to "jump back in time"
At the bottom, you'll see:
Speed control: 1x = 1 candle per second, 10x = 10 candles per second
Play/Pause: Start and stop the replay
Jump to realtime: Return to live chart
You can actually simulate trades during replay:
Click "Buy" when you see a setup
Set your take-profit and stop-loss
Click "Confirm"
Press play and watch the trade unfold
When you exit replay mode, TradingView shows your results: win rate, total profit, best trade.
"This can actually be a very useful tool because you can practice—how would you have traded this chart? It's often much easier to look back at a chart and take a look at 'I would have done this, I would have done that.' But when you use the replay tool, you get a more sort of live feeling."
Paper trading lets you practice with fake money in real-time markets.
Click the Trading Panel button at the bottom of the screen
Select Paper Trading from the broker list
Click Connect
You start with $100,000 in fake money.
Right-click on the chart → "Add order on [symbol]"
Or use the Buy/Sell buttons at the top
Choose Market order (buys/sells at current price)
Set your quantity (e.g., 1 BTC)
Set take-profit and stop-loss levels
Click Buy or Sell
In the Trading Panel, you'll see:
Positions: Your open trades with real-time P&L
Orders: Pending take-profits and stop-losses
History: Completed trades
Account: Your fake money balance over time
In the Trading Panel, click the menu icon and select "Log out of paper trading."
Why paper trading matters: It lets you test strategies and build confidence before risking real capital. Even experienced traders use it when testing new approaches.
If you've followed this tutorial from start to finish, you now have everything you need to start experimenting on your own. You can begin slowly building your strategy and finding what works for you.
Here are the courses I recommend watching next:
Support and Resistance (1 hour) - Master key levels
Chart Patterns (1 hour) - Learn bullish and bearish patterns
RSI Indicator - Deep dive into momentum trading
Smart Money Concepts - How institutions trade
All of these are available free on the Mind Math Money YouTube channel.
Yes, TradingView offers a free plan that's actually quite capable for beginners. You can use candlestick charts, add up to 2 indicators per chart, set basic alerts, and access most drawing tools. However, the free version includes ads and limits you to one chart per tab. Most beginners should start free and upgrade only when limitations become frustrating.
The main differences are: Essential allows 2 charts per tab and 5 indicators, Plus offers 4 charts and 10 indicators, and Premium provides 8 charts and 25 indicators. Premium also unlocks advanced features like volume profile, volume footprint, and extended alerts. For most retail traders, Essential or Plus is sufficient.
Yes, TradingView integrates with several brokers including Bybit, OANDA, and others. You can connect your broker account and execute trades directly from TradingView charts. However, many traders use TradingView purely for analysis while trading on a separate platform.
Always search using ticker symbols rather than full names. For Bitcoin, search "BTC" not "Bitcoin." For Tesla, search "TSLA." This gives more accurate results. Also note that crypto trades on multiple exchanges—the same asset on Binance vs Coinbase may show slightly different prices.
There's no single "best" time frame—it depends on your trading style. Day traders often use 5-minute to 1-hour charts, swing traders prefer 4-hour to daily, and position traders focus on daily to weekly. Many traders use multiple time frames together for confirmation.
TradingView automatically saves your work when you're logged in. You can also manually save chart layouts by clicking the layout icon in the top toolbar. Creating templates for your favorite indicator setups saves time when analyzing new assets.
Linear scale shows equal dollar amounts at equal distances, while logarithmic scale shows equal percentage moves at equal distances. Use logarithmic for long-term charts (especially crypto) where early price moves would be invisible on linear scale. Use linear for short-term day trading.
Yes, TradingView has excellent mobile apps for both iOS and Android. You can also use the desktop app for Windows and Mac, which offers better performance than the web version. All your charts, indicators, and alerts sync across devices.
Now that you know TradingView, learn how institutional traders move markets.
Go deeper on the drawing tools you just learned with advanced S&R strategies.
Master the exact Fibonacci settings and golden zone strategy for better entries.
Detailed breakdown of every TradingView plan to help you choose the right one.
Trading & Investing Enthusiast
Teaching traders to understand market psychology, technical analysis, and investing through clear beginner-friendly insights.
Started investing at 16 and became fascinated by how market psychology influences price movements. Still learning something new every day.
Love sharing what I've learned along the way. There's nothing quite like helping someone understand a concept that once confused me too.
Proud to have built a community where traders actively share insights and grow together through daily market analysis and discussion.
Want to join our learning journey?
Put what you just learned into practice
Exclusive offer for Mind Math Money viewers